
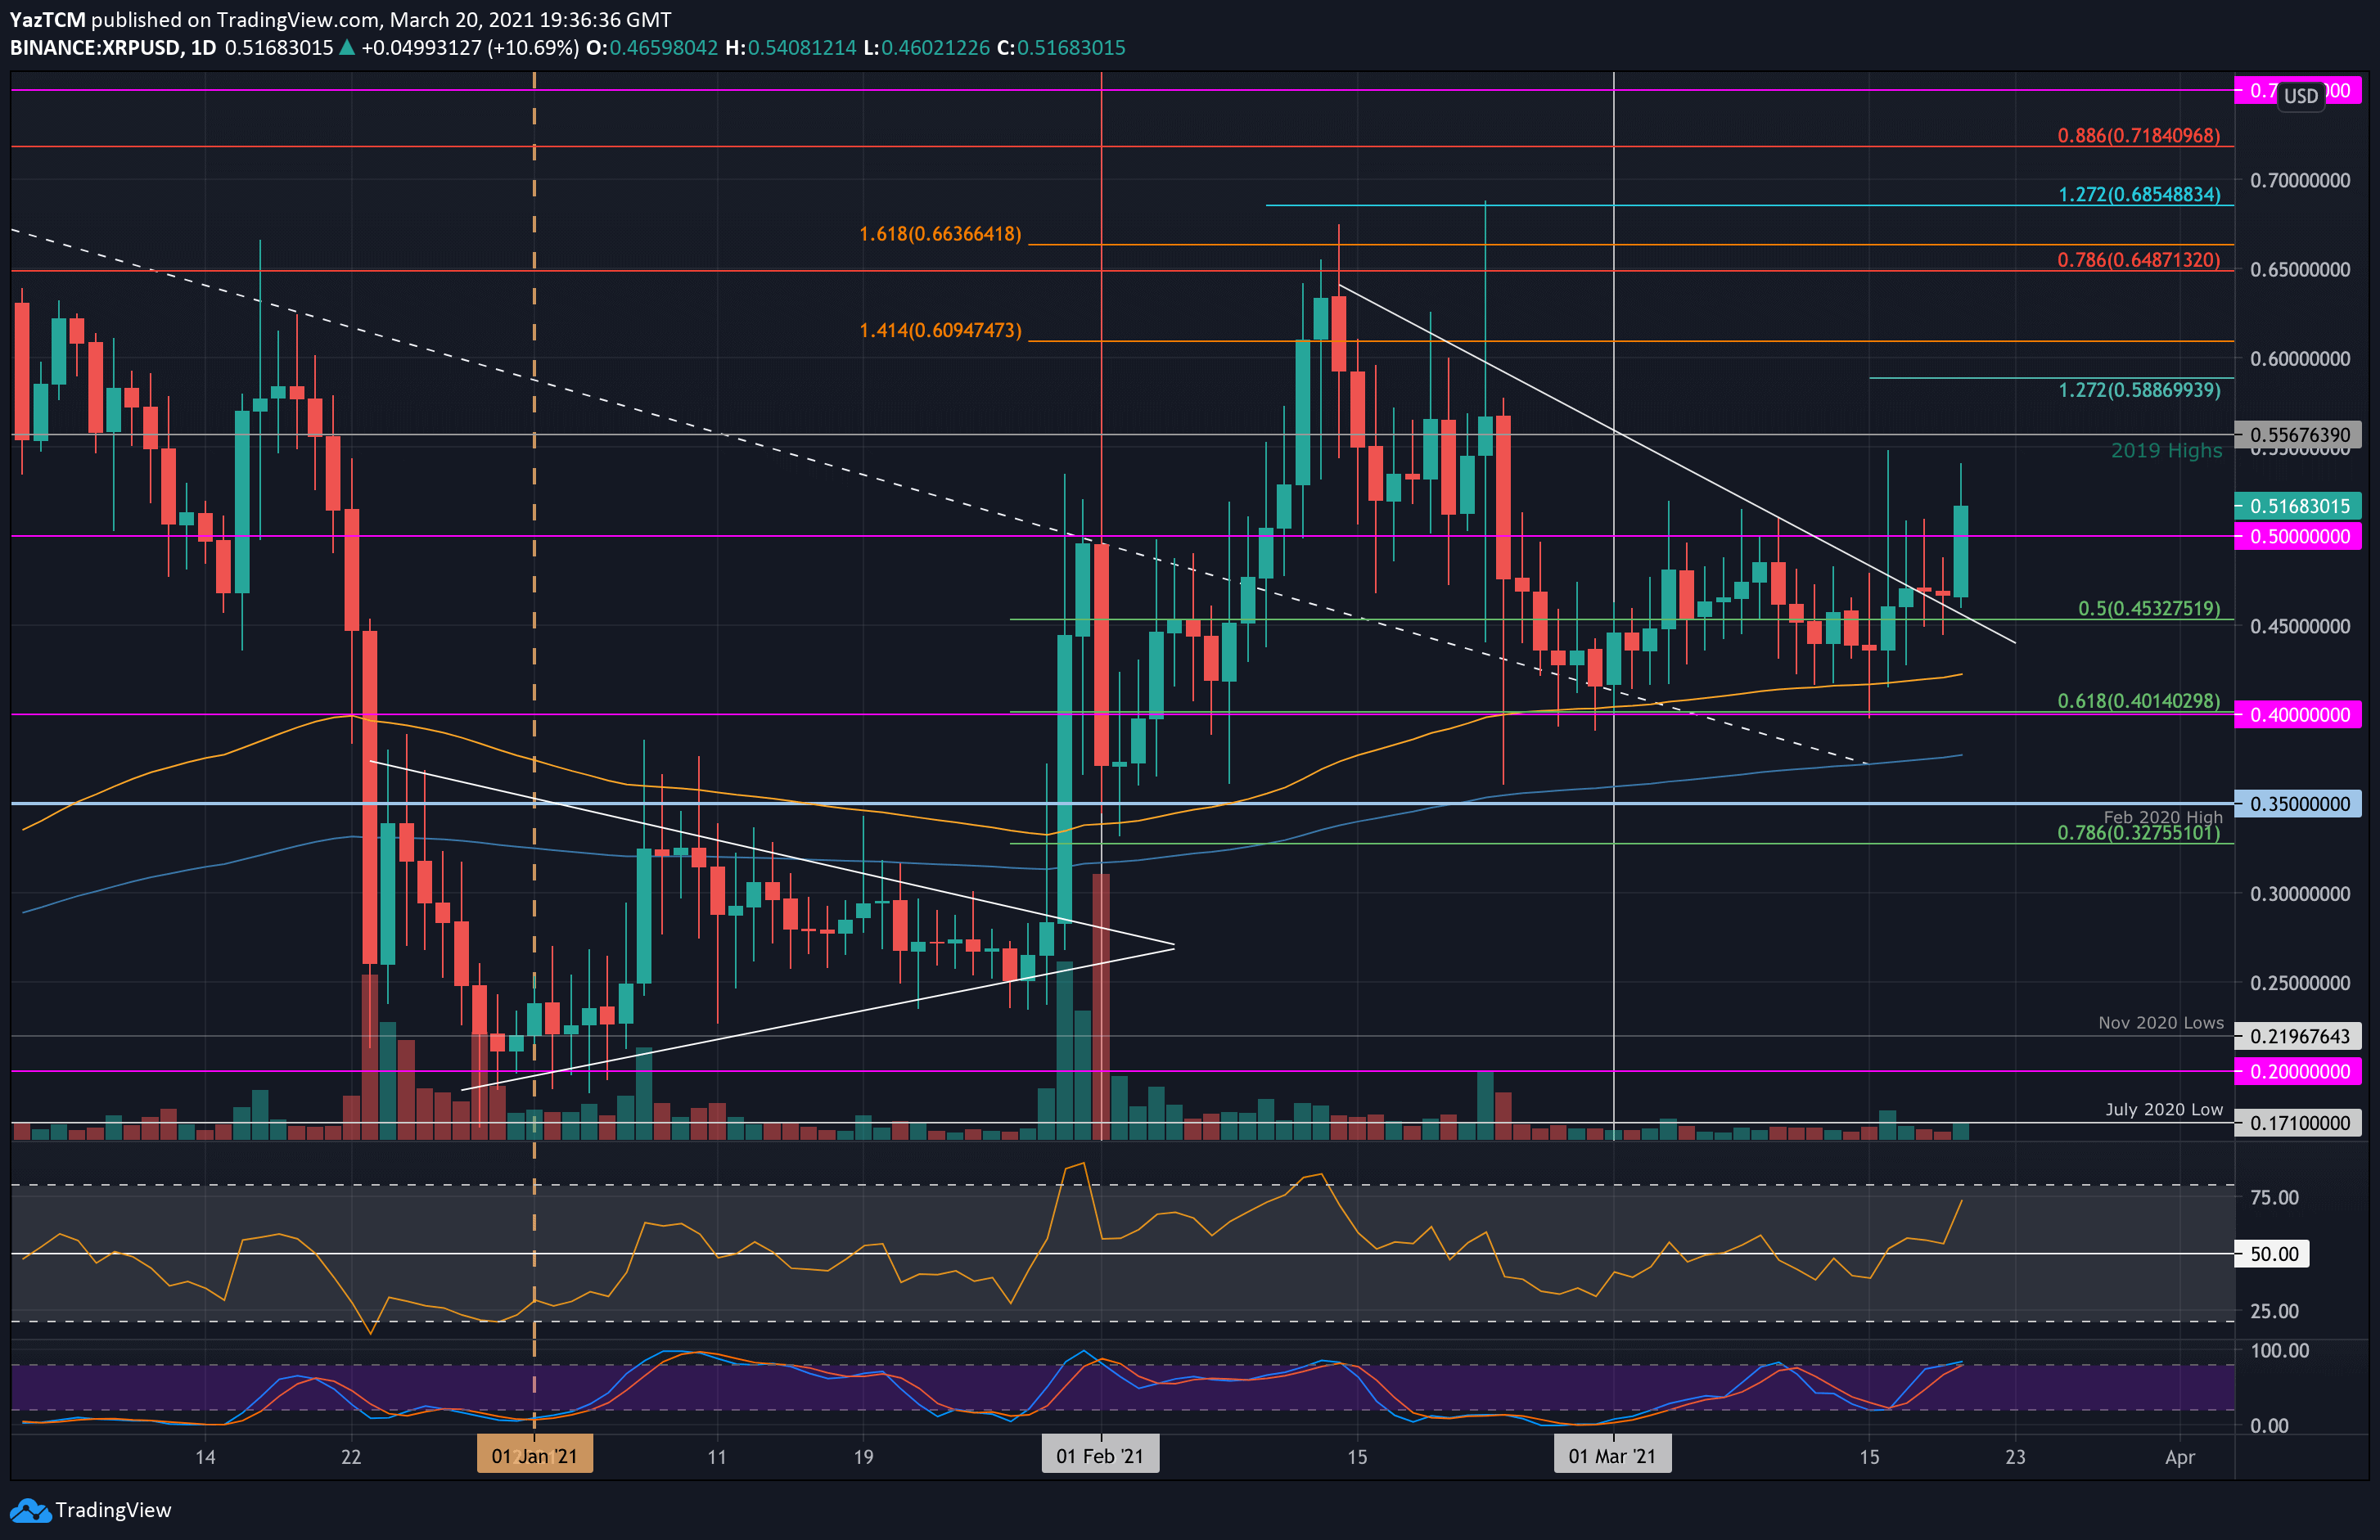
XRP/USD – Bulls Finally Break Back Above $0.5.
Key Support Levels: $0.5, $0.453, $0.42.
Key Resistance Levels: $0.556, $0.588, $0.6.
Since mid-February, XRP was trading inside a falling wedge pattern after dropping from resistance near $0.65. The cryptocurrency attempted to break above the upper boundary of this wedge in the first fortnight of March but failed to overcome resistance at $0.5.
As a result, XRP went on to drop further straight into support at the 100-day EMA before bouncing higher. This week, XRP showed signs of a bullish breakout after finally managing to trade above the wedge pattern. However, it failed in closing a daily candle above it.
The true breakout came today as XRP surged higher from $0.45, surpassing above $0.5 to reach the current $0.52 trading level. A daily price increase of over 10%.
XRP-USD Short Term Price Prediction
Looking ahead, the first level of resistance lies at $0.556 (2019 Highs). This is followed by $0.588 (1.272 Fib Extension – green), $0.6, and $0.65 (bearish .786 Fib Retracement).
On the other side, the first level of support now becomes $0.5. This is followed by $0.453 (.5 Fib), $0.42 (100-days EMA), and $0.4 (.618 Fib Retracement).
The RSI has surged higher from the midline as it reached 70, indicating that the buyers are fully in control of the market momentum as of now. It still has room before reaching the overbought territory.
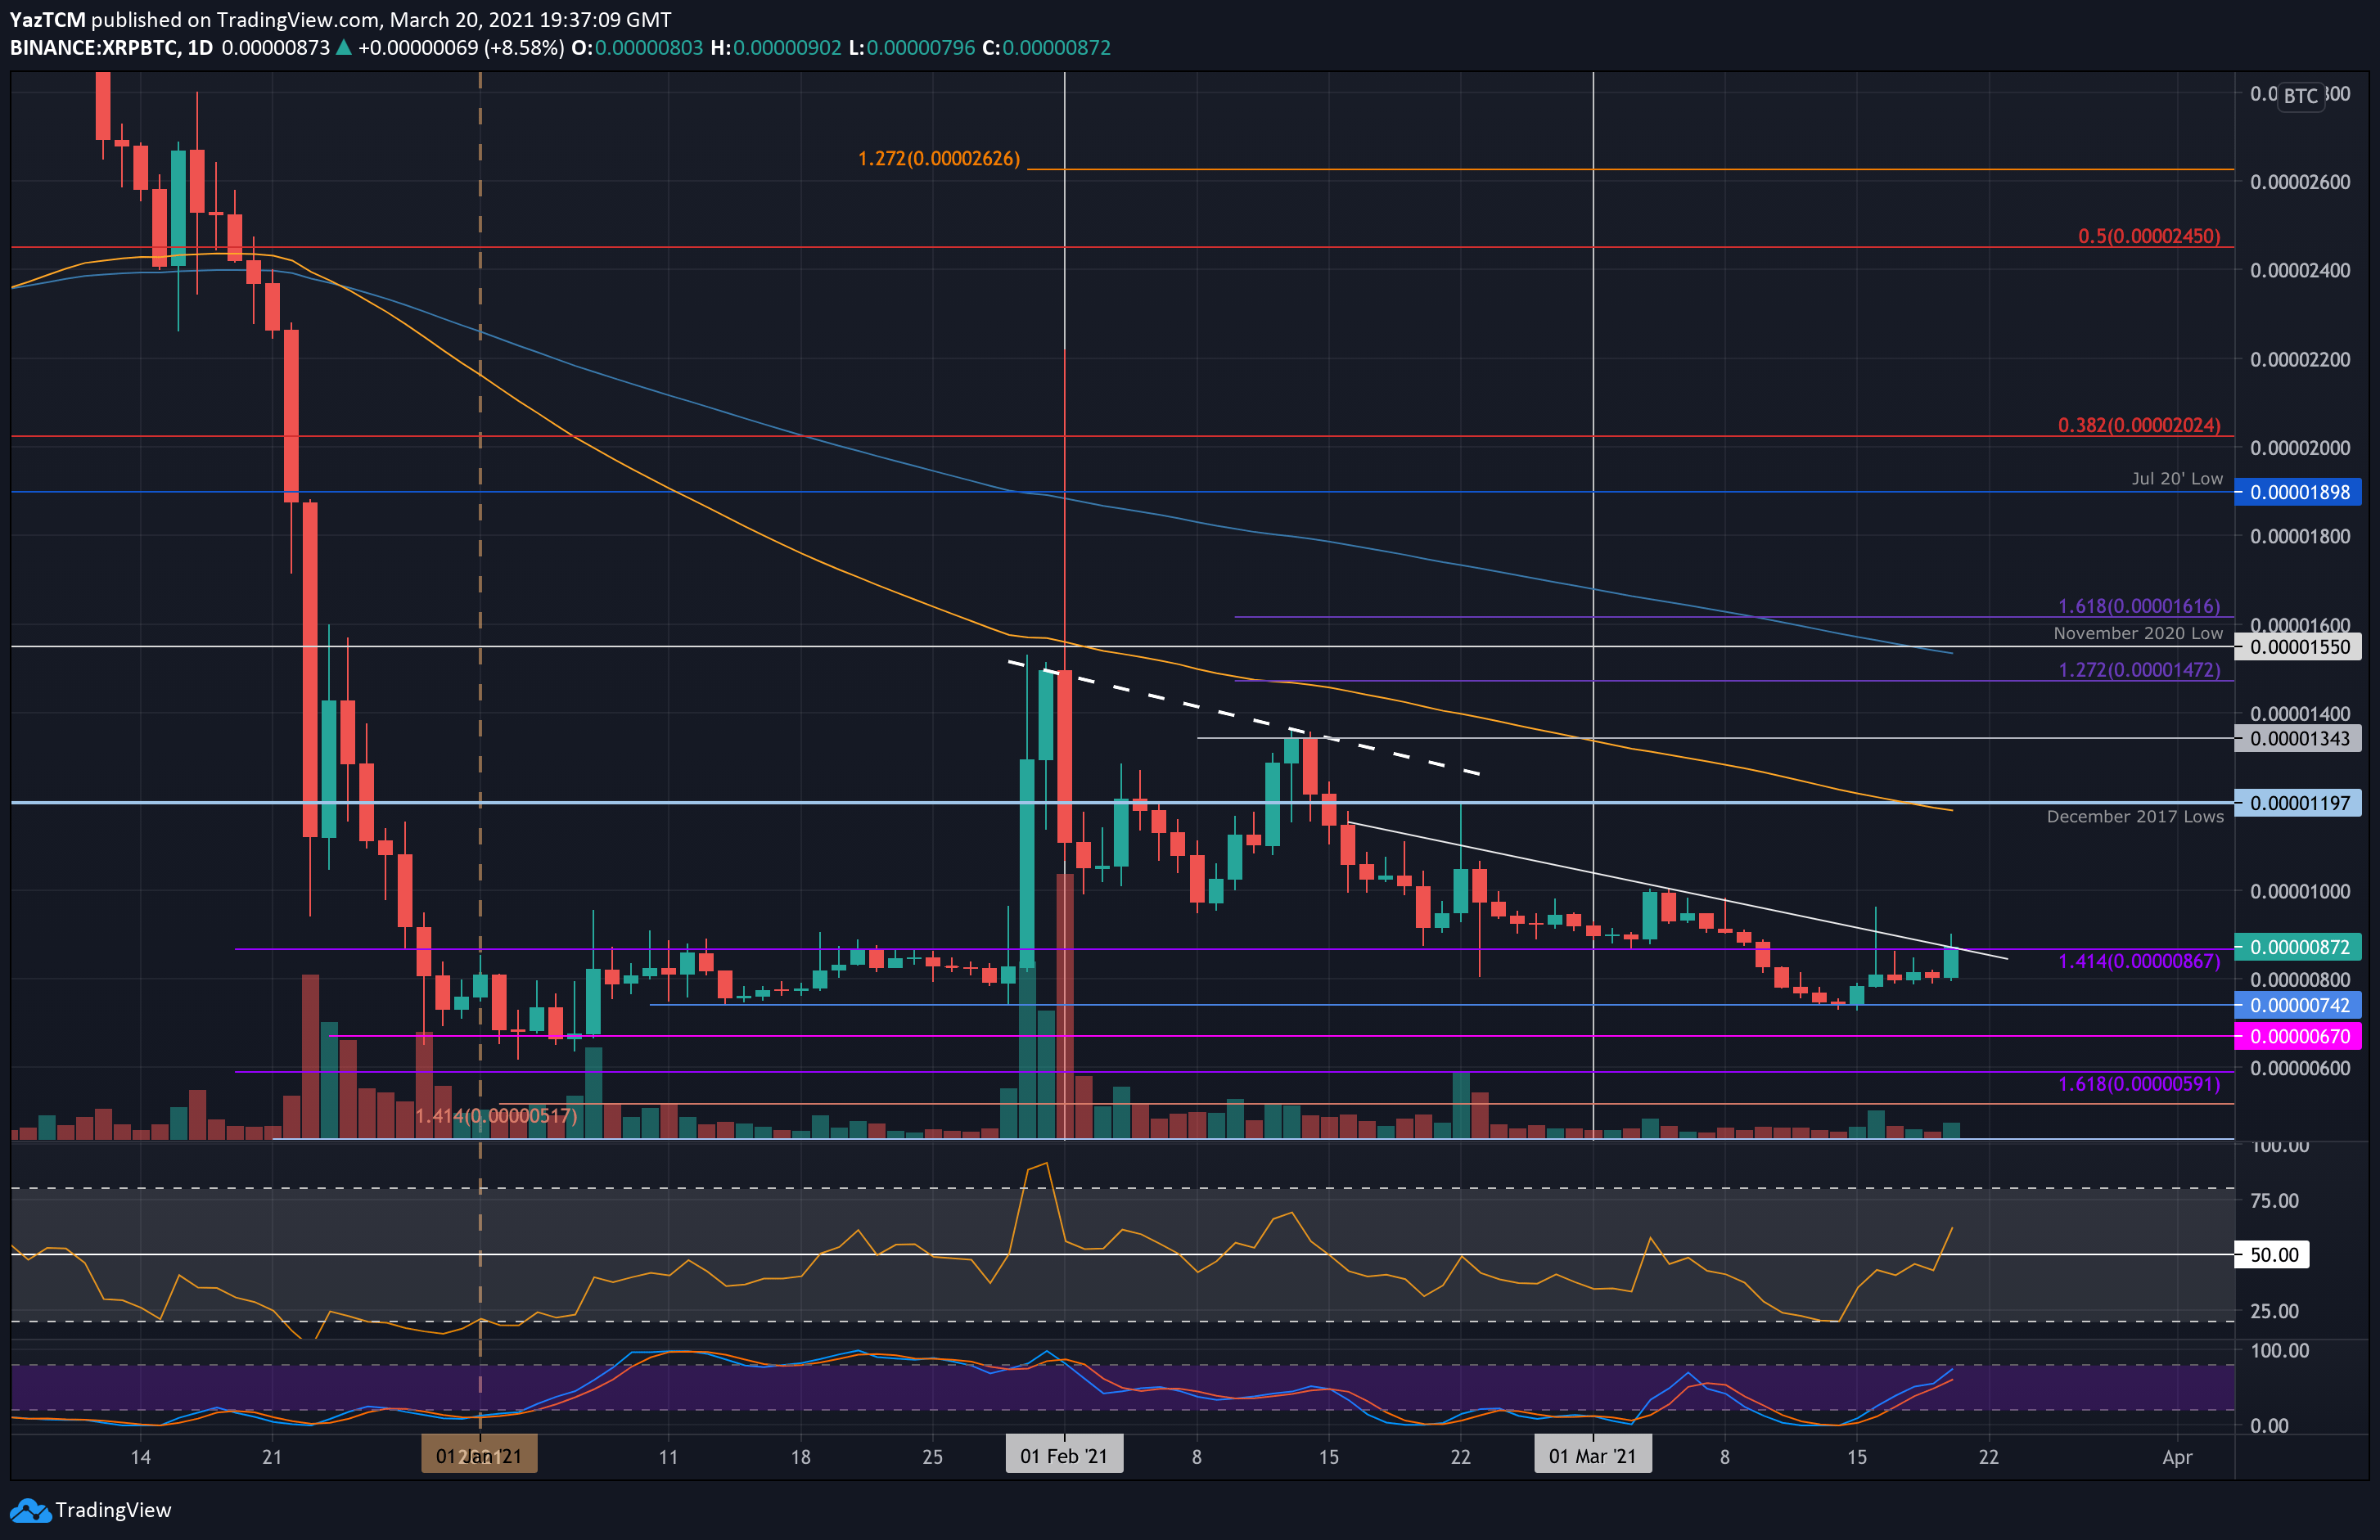
XRP/BTC – Bulls Attempt To Break Descending Trend Line.
Key Support Levels: 800 SAT, 740 SAT, 670 SAT.
Key Resistance Levels: 867 SAT, 1000 SAT, 1200 SAT.
Against Bitcoin, XRP had dropped into the January trading range between 867 SAT and 670 SAT last week as the bears started to push the market lower. The cryptocurrency rebounded from support at 742 SAT and established solid bottom at 800 SAT over the last five days.
Today, XRP pushed higher from 800 SAT and is now tackling the trading range’s upper boundary at 867 SAT. This resistance is further bolstered by a descending trend line that has been in play since late-February.
XRP-BTC Short Term Price Prediction
Moving forward, the first level of resistance lies at 867 SAT. This is followed by 1000 SAT, 1200 SAT (100-day EMA & December 2017 lows), and 1345 SAT.
On the other side, the first support lies at 800 SAT. This is followed by 740 SAT, 670 SAT, and 600 SAT.
The RSI has also penetrated above the 50 level, indicating the buyers have finally retaken control of the market momentum. If it can continue to rise, the bullish momentum will increase and might help XRP break the current resistance.
PrimeXBT Special Offer: Use this link to register & enter CRYPTOPOTATO35 code to get 35% free bonus on any deposit up to 1 BTC.
Disclaimer: Information found on CryptoPotato is those of writers quoted. It does not represent the opinions of CryptoPotato on whether to buy, sell, or hold any investments. You are advised to conduct your own research before making any investment decisions. Use provided information at your own risk. See Disclaimer for more information.
Cryptocurrency charts by TradingView.
Author: Yaz Sheikh ::: Source link


