
Yesterday, bitcoin surged by an impressive 9% from daily low to daily high, surpassing the $58k mark. This continues the ongoing bullish week for BTC. Just six days ago, on Sunday, bitcoin price plunged to as low as $47k.
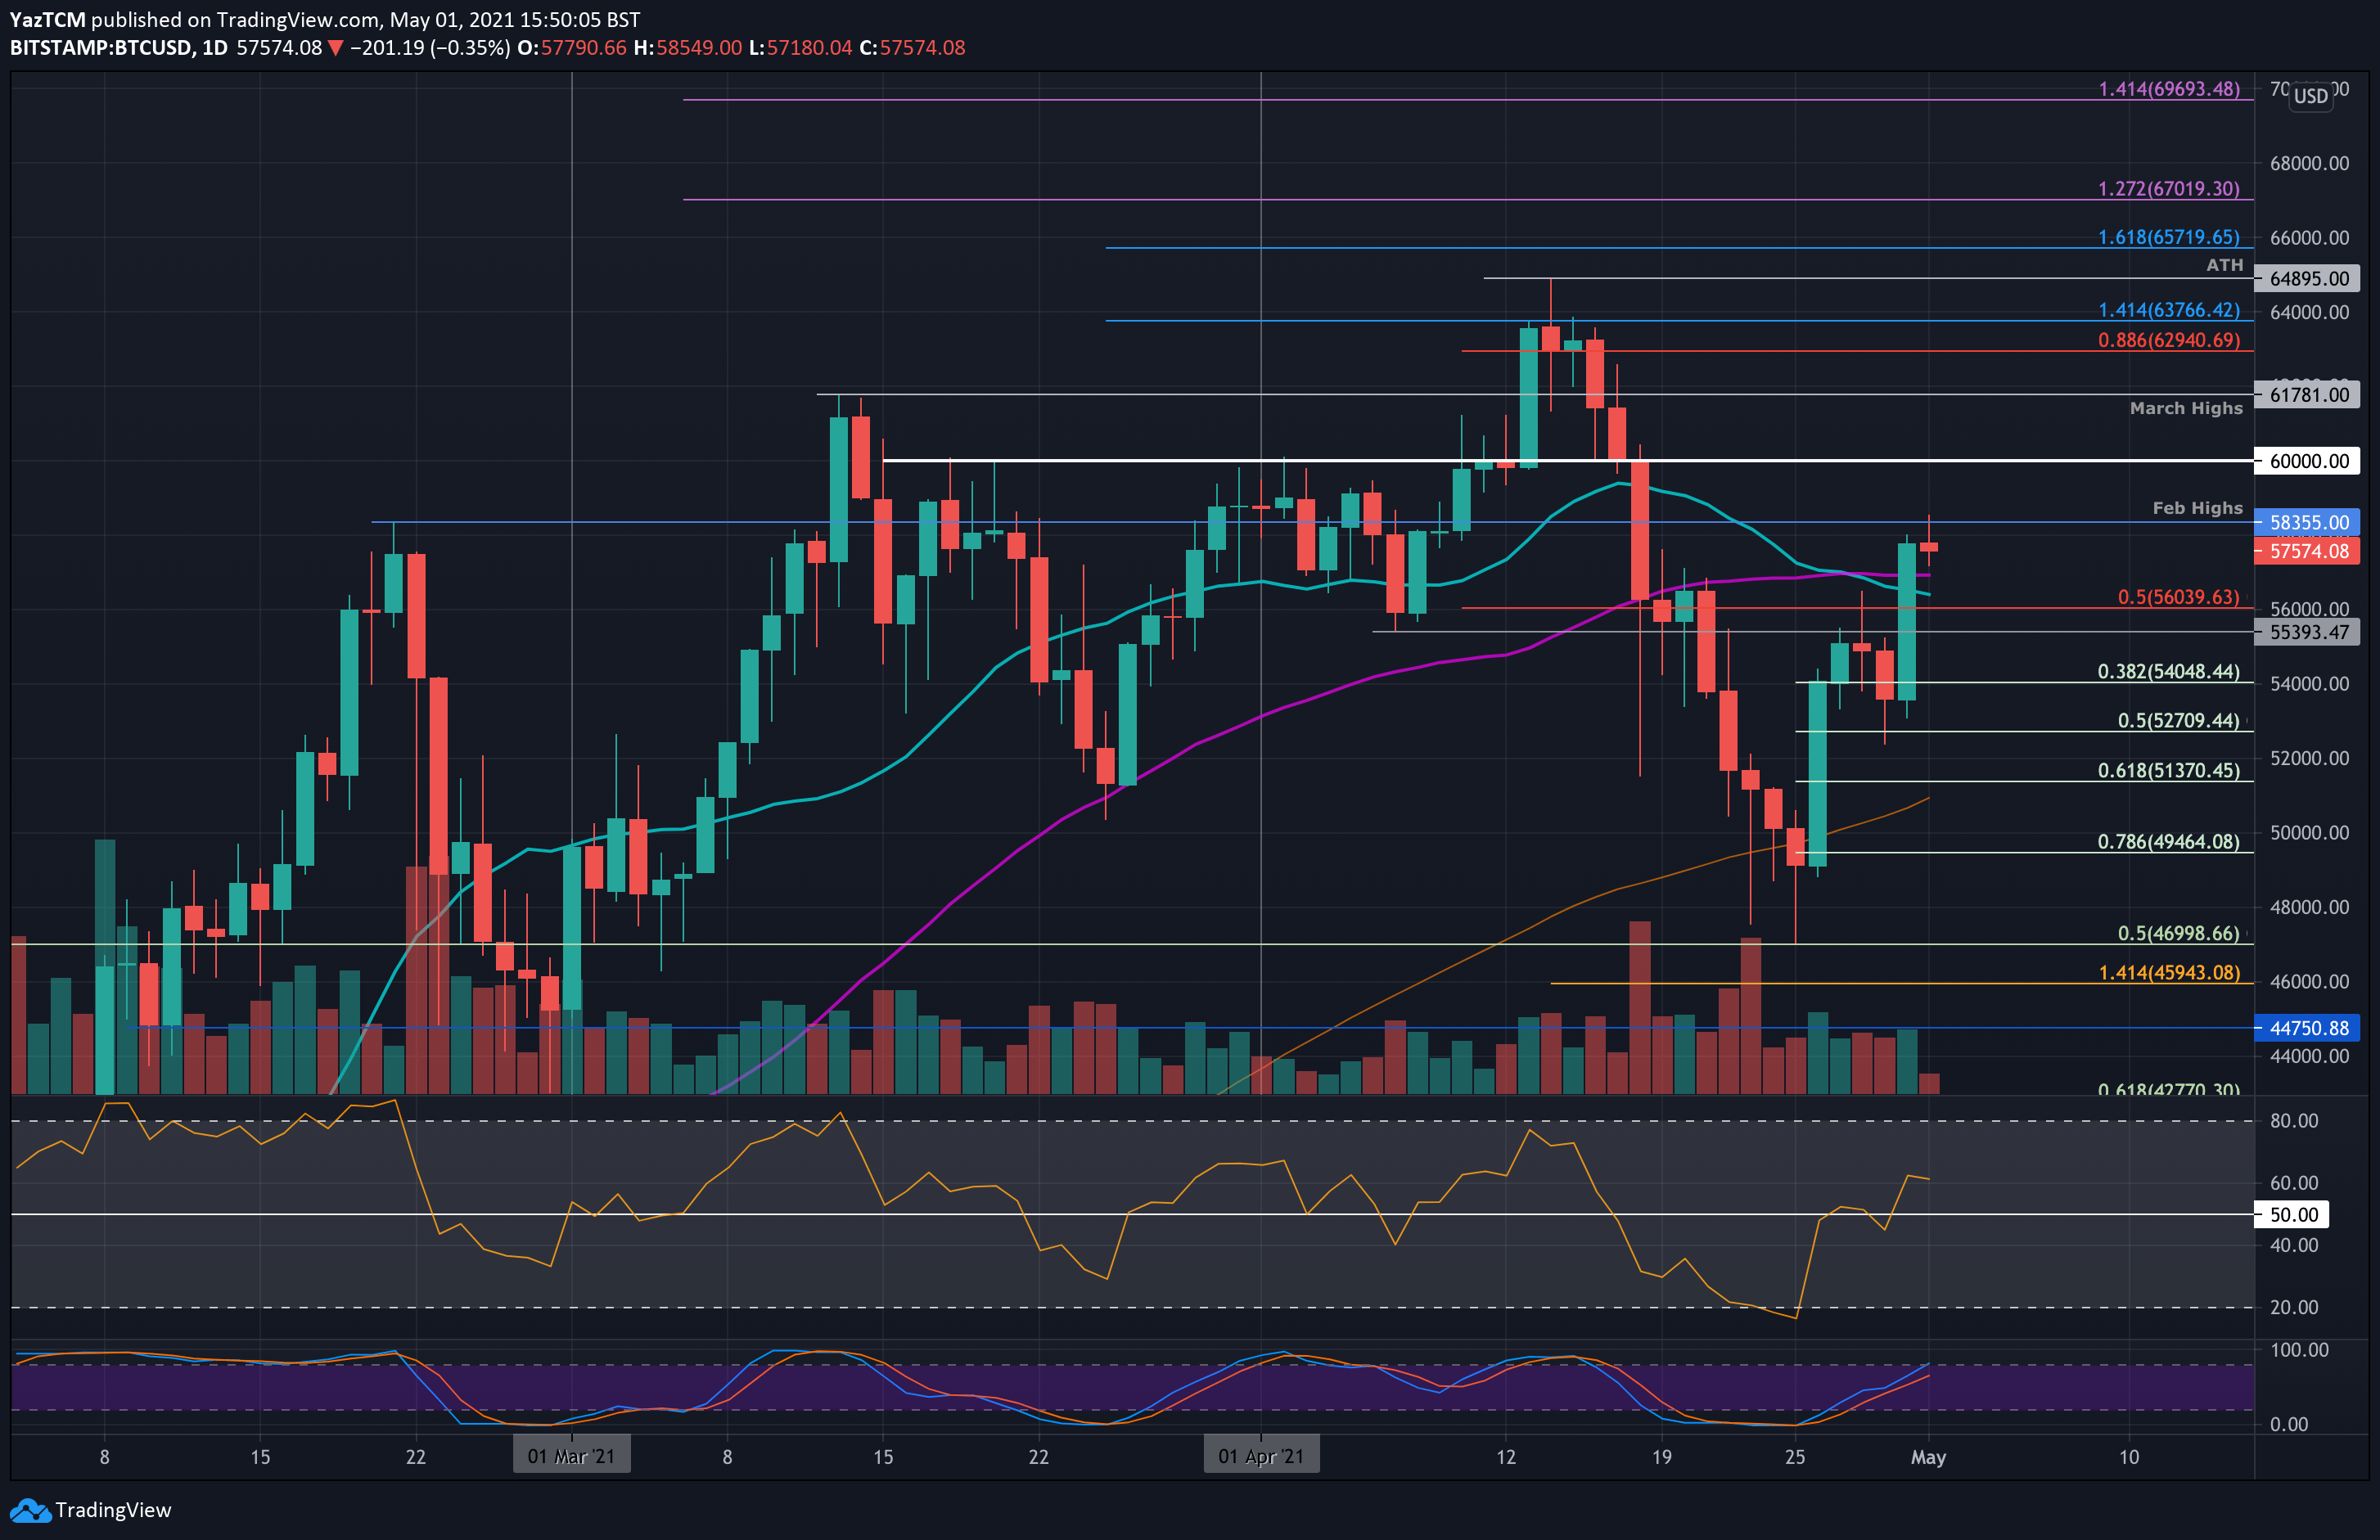
Yesterday’s spike allowed bitcoin to climb back above the significant 50-day moving average line, after spending 11 days beneath it. Before this, bitcoin hadn’t seen a daily close beneath the 50-days MA since October 2020.
As a quick recap, BTC broke below the 50-days MA on April 19th and continued to head lower from there until it found support at $47,000 (.5 Fib) last Sunday, as mentioned above.
Earlier today, the bulls encountered a significant resistance area at $58,355, which was the previous all-time high set at mid-February. This resistance was further bolstered by the upper angle of a short-term ascending price channel.
After reaching this resistance, bitcoin retraced over $1000 to where it is trading right now. According to Bitstamp, the daily MA-50 now lies at approximately $56,930. This, together with the $57k horizontal support, is the first major support bulls should look at.
BTC Price Support and Resistance Levels to Watch
Key Support Levels: $56,950 / $57k (MA-50), $56,400 (MA-20), $55,400, $54,050, $52,700.
Key Resistance Levels: $58,355, $59,000, $60,000, $61,780, $62,940.
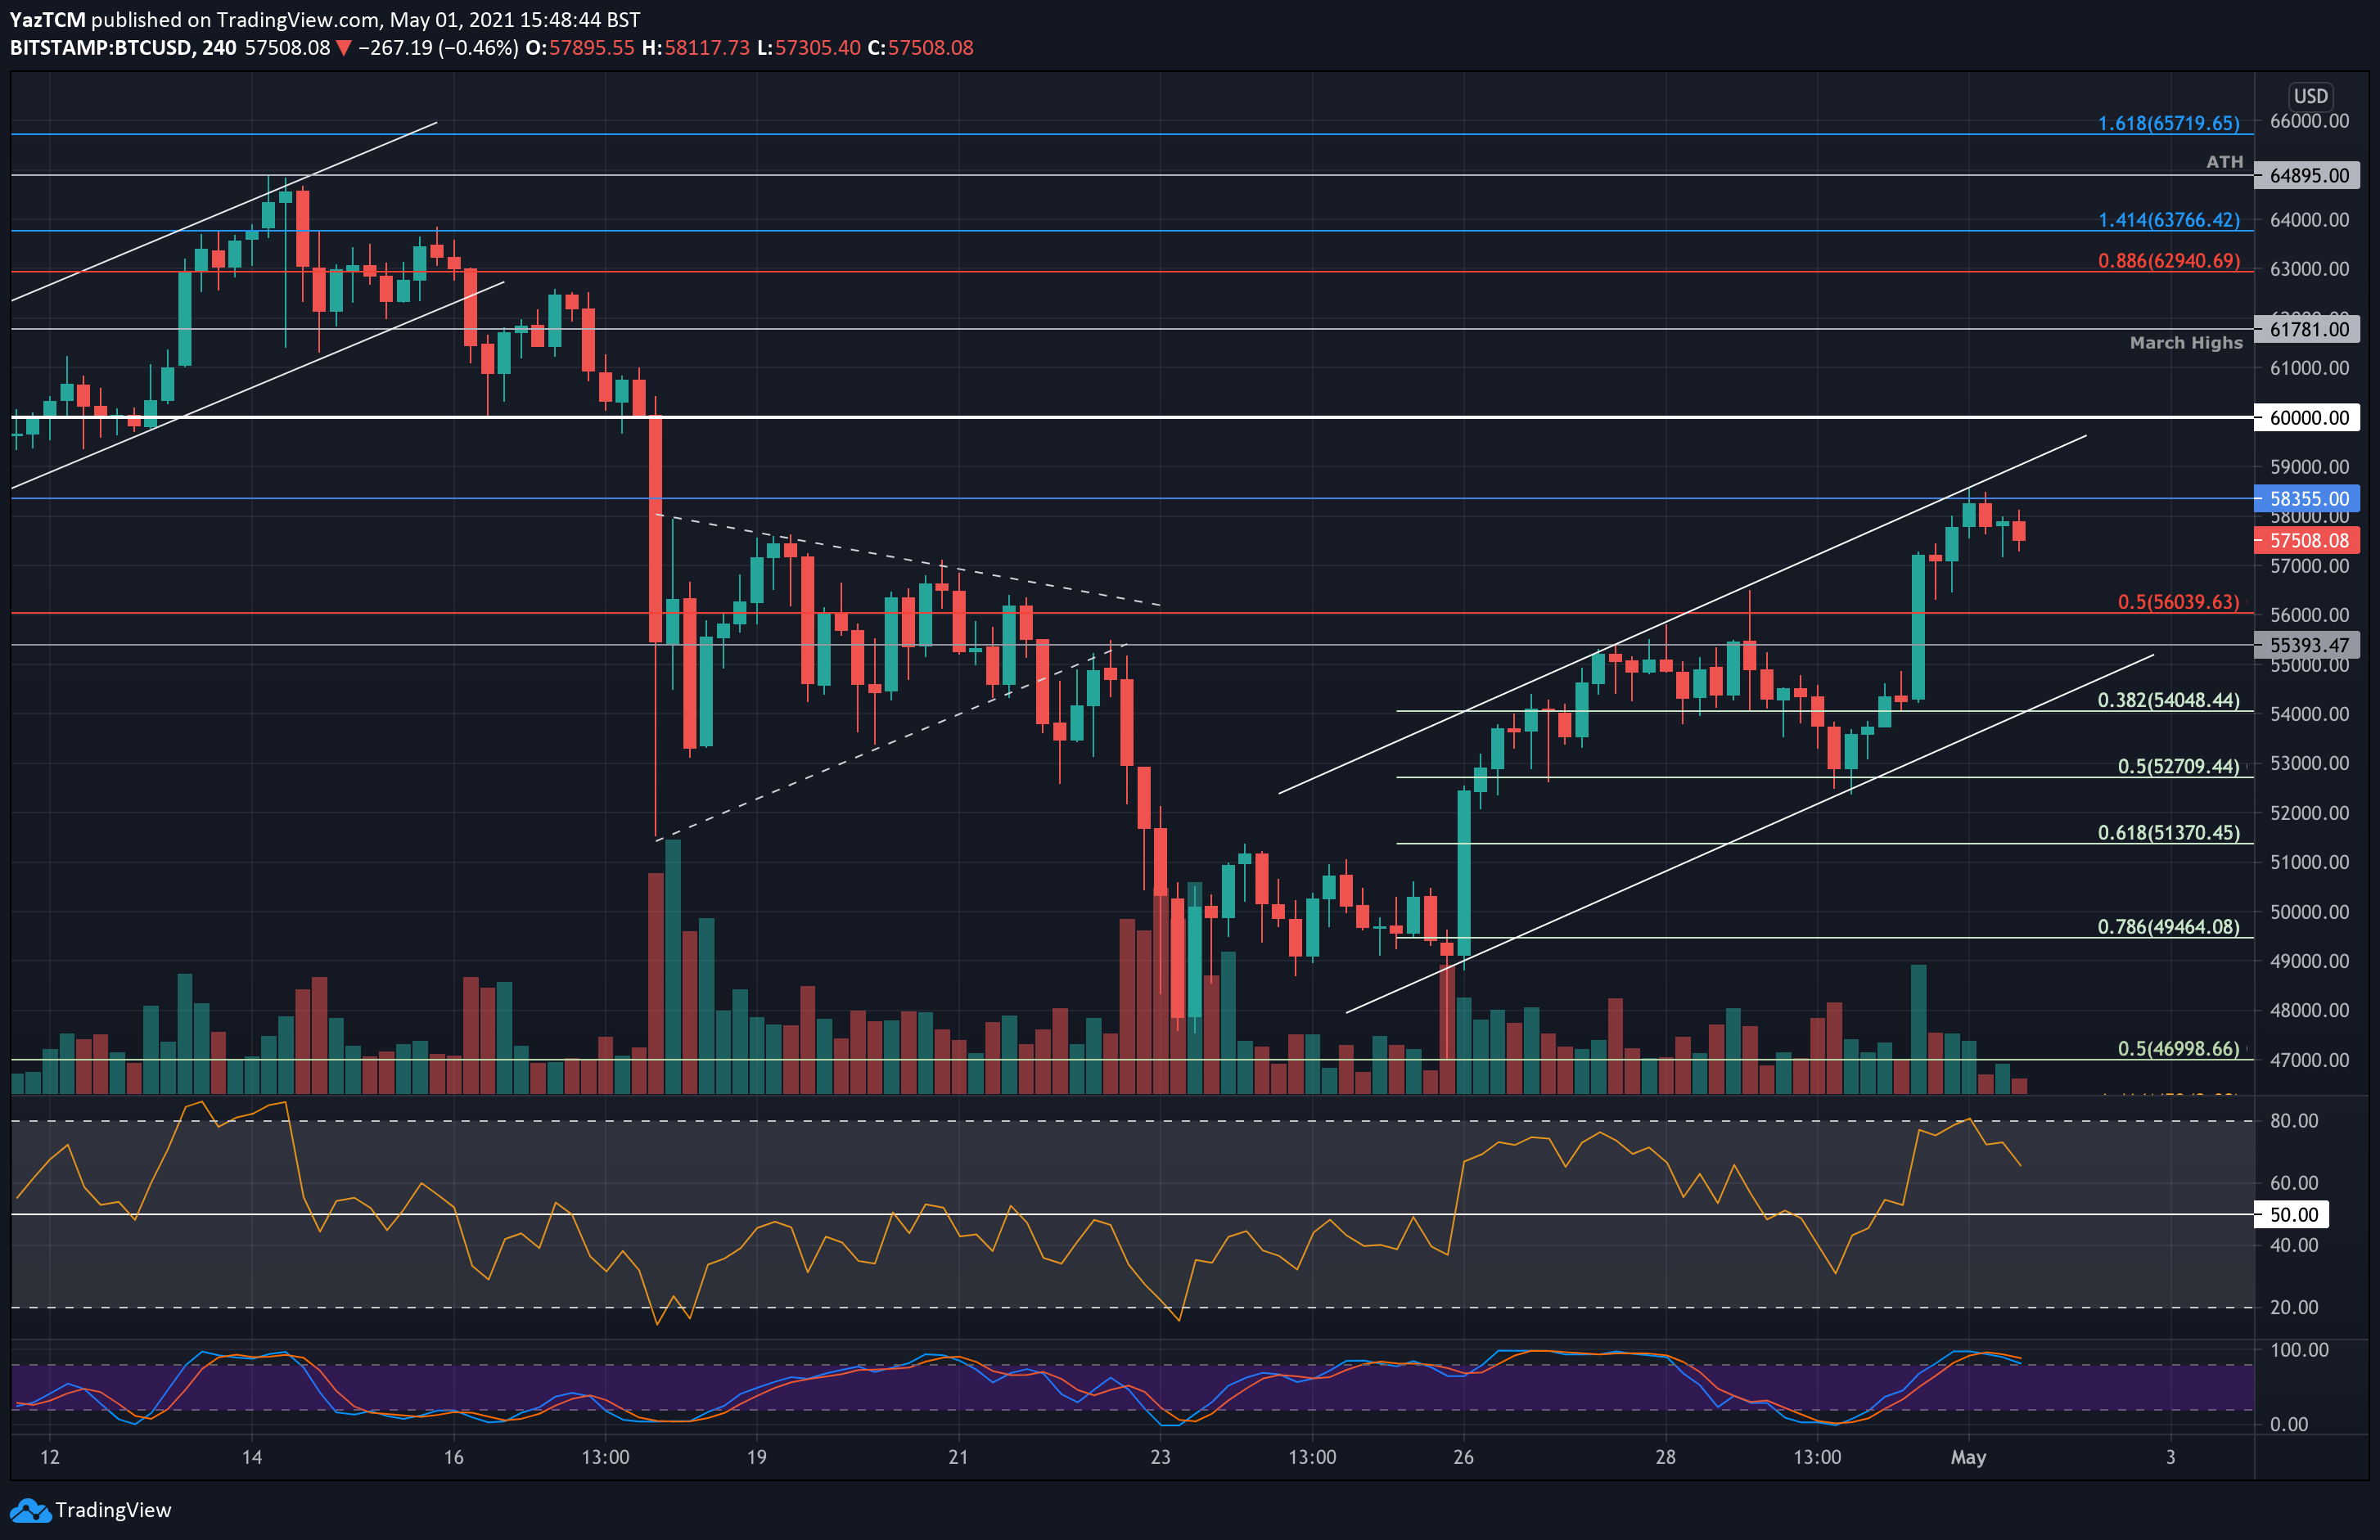
Looking ahead, the first resistance lies at $58,355 (Feb highs or today’s highest). This is followed by $59,000 (upper angle of ascending price channel), $60,000, $61,780 (March previous all-time high), and $62,940 (bearish .886 Fib).
On the other side, the first support lies at $57k – $56,950 (50-days MA). This is followed by $56,400 (MA-20), $55,400, $54,000 (.382 Fi), and $52,700 (.5 Fib & lower angle of the price channel).
The RSI managed to break the midline and climb above 60, indicating that the bulls have taken control of the short-term momentum and are increasing their hold. This is a positive sign for the bulls, signals that the uptrend is healthy. This comes along with Bitcoin whales reportedly accumulating Bitcoin below $50k earlier this week.
Bitstamp BTC/USD Daily Chart
Bitstamp BTC/USD 4-Hour Chart
Binance Futures 50 USDT FREE Voucher: Use this link to register & get 10% off fees and 50 USDT when trading 500 USDT (limited offer).
PrimeXBT Special Offer: Use this link to register & enter POTATO50 code to get 50% free bonus on any deposit up to 1 BTC.
Disclaimer: Information found on CryptoPotato is those of writers quoted. It does not represent the opinions of CryptoPotato on whether to buy, sell, or hold any investments. You are advised to conduct your own research before making any investment decisions. Use provided information at your own risk. See Disclaimer for more information.
Cryptocurrency charts by TradingView.
Author: Yaz Sheikh ::: Source link

 Price Slumps Below $58K Amid Mt. Gox, German Government Wallet Movements")

