
- Tezos saw a slight bounce back following a daily 10% price increase.
- Against Bitcoin, Tezos might be forming a bull flag pattern.
XTZ/USD: Tezos Bounced, But Remains Short-term Bearish
Key Resistance Levels: $3, $3.9
Key Support Levels: $2.3, $2
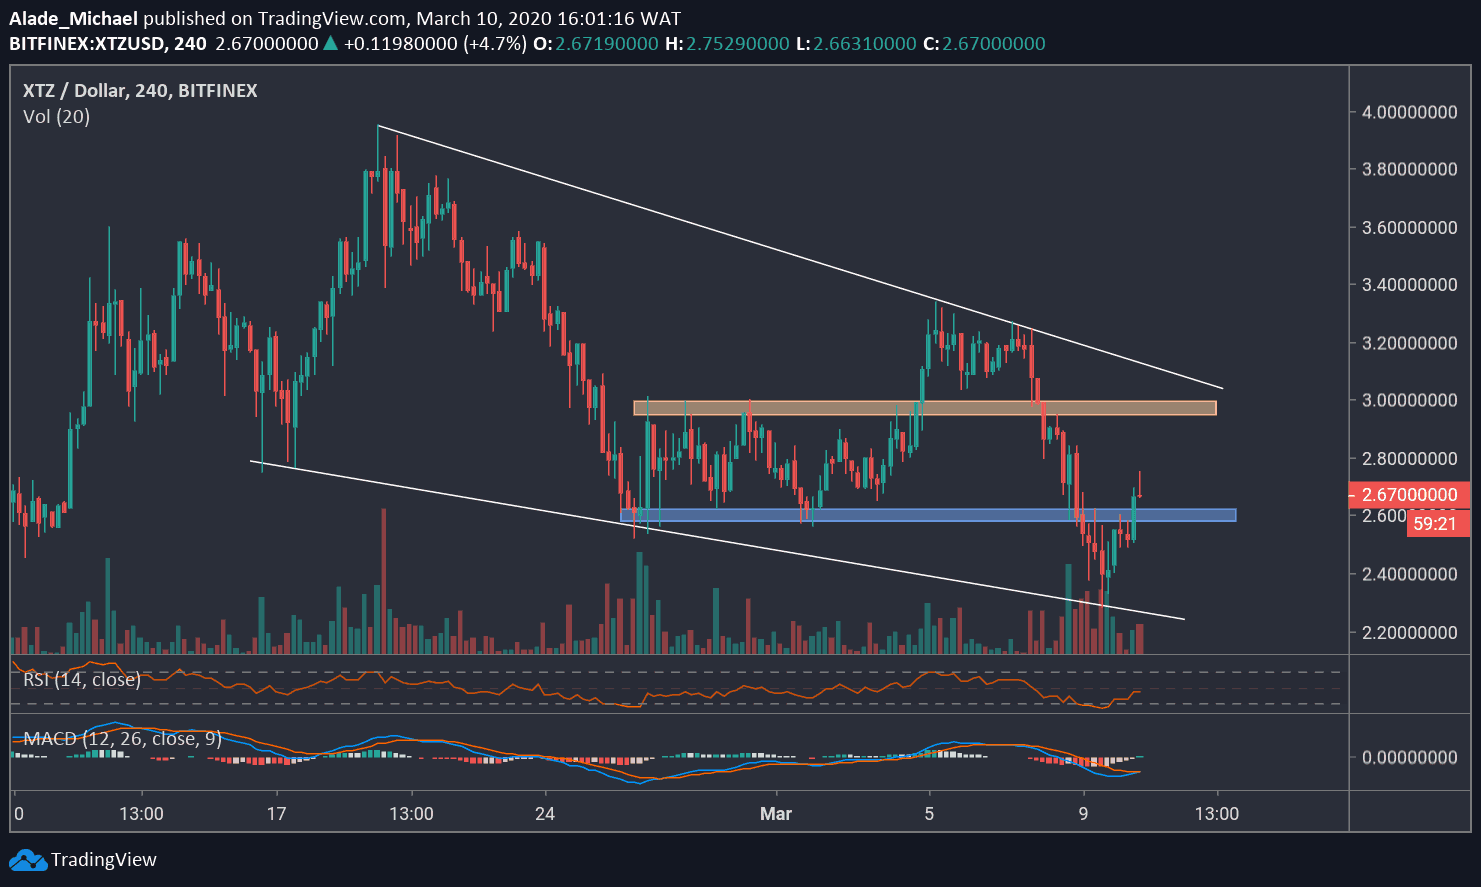
Following this week’s bearish start, XTZ saw a massive drop of 18% to a three-week low at $2.3. This drop was in correlation with the Bitcoin decline of the past days.
Today, Tezos recovered 10% over the past 24-hours. At the moment, XTZ is trading for $2.6.
Though XTZ is still trading inside a descending wedge, we can expect some bullish price action in case the wedge breaks to the upside. However, as it stands now, Tezos is still under a short-term bearish correction.
Tezos-USD Short Term Price Prediction
As we can see on the 4-hour chart, Tezos bounced off the wedge’s support of $2.3, followed by a slight break above $2.6 resistance – where the blue area lies. A further increase from here should allow XTZ to reach a psychological resistance of $3 in the orange zone.
If Tezos breaks above this wedge, it will likely target $3.9, the resistance from where the Tezos price started dropping mid-February.
A steep drop below the $2.6 level could initiate a severe sell-off to the wedge’s support level at $2.3. If the sellers break the latter, then Tezos may create another weekly low around $2 or even $1.8.
Looking at the technical indicators, we can see that Tezos is slowly regaining momentum on both the RSI and the MACD. Nonetheless, Tezos needs to rise above the mid-levels for bullish confirmation.
XTZ/BTC: Tezos Forming a Bull Flag Pattern
Key Support Levels: 0.00036 BTC, 0.00040 BTC
Key Resistance Levels: 0.00030 BTC, 0.00025 BTC
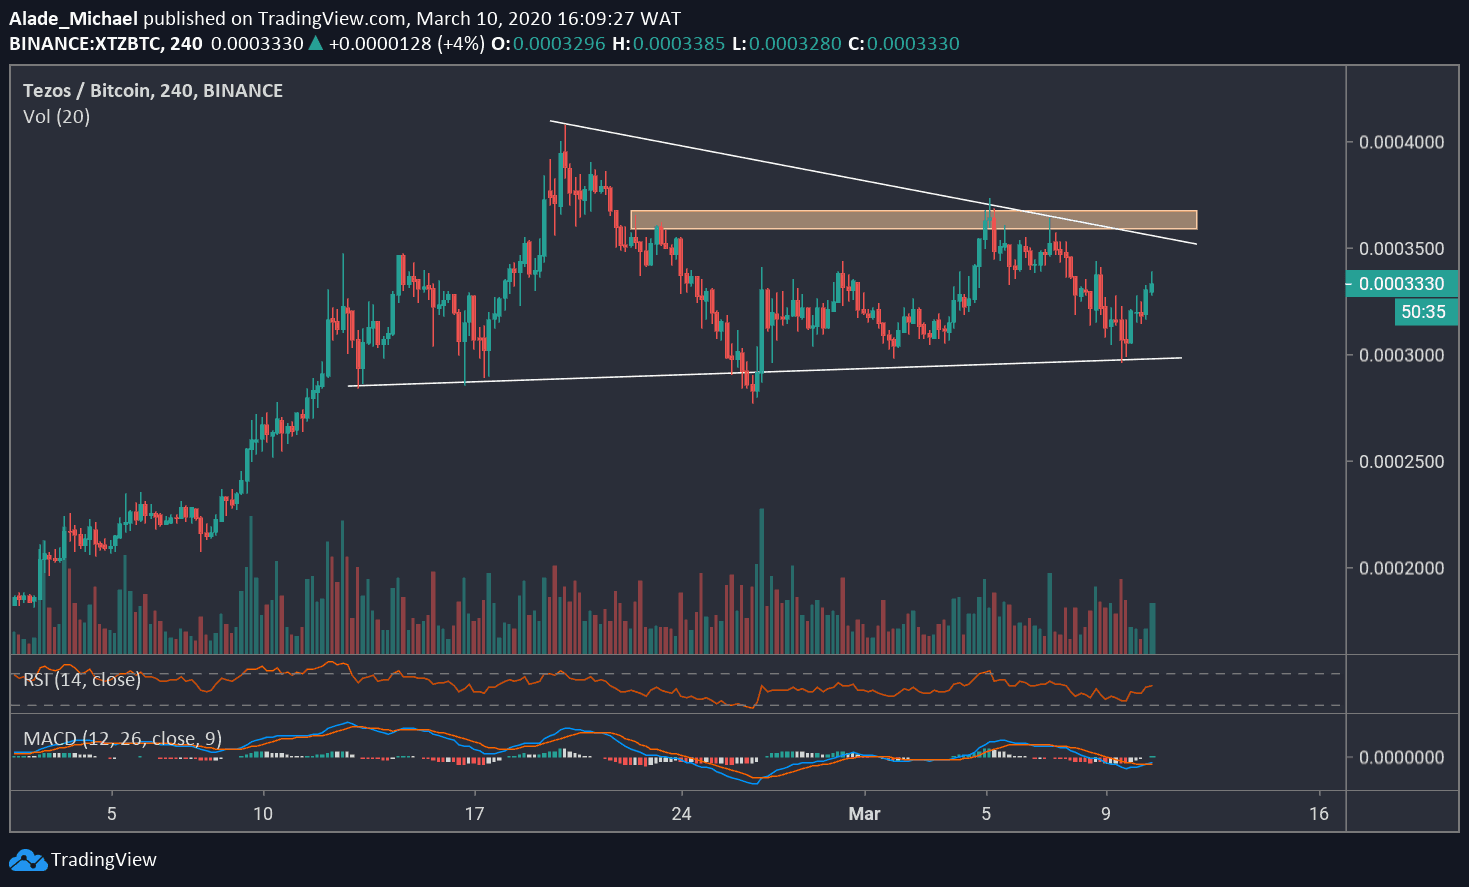
After finding support around the 0.00030 BTC level yesterday, Tezos bounced back and now trading around the 0.000330 BTC level following 6.5% gains at the moment.
Meanwhile, a bull flag pattern is forming on the 4-hours chart and could trigger a new bullish momentum for Tezos, in case of a breakout.
Tezos-BTC Short Term Price Prediction
If the bullish flag pattern plays out, the closest resistance to watch is the 0.00036 BTC level (February 20 high), marked orange on the chart. A clear move above this level would allow a nice increase towards the current 2020 high of 0.00040 BTC.
In case Tezos rejects below the orange area, the first support level to consider is 0.00030, which is today’s low. A dip beneath this support could initiate a sell-off to 0.00025 level.
Currently, the RSI is shooting up following the price recovery. Though the MACD is currently negative but we can anticipate a positive move once a crossover occurs.
Click here to start trading on BitMEX and receive 10% discount on fees for 6 months.
Disclaimer: Information found on CryptoPotato is those of writers quoted. It does not represent the opinions of CryptoPotato on whether to buy, sell, or hold any investments. You are advised to conduct your own research before making any investment decisions. Use provided information at your own risk. See Disclaimer for more information.
Cryptocurrency charts by TradingView.
Author: Michael Fasogbon ::: Source link


