
ETH/USD – Market Falls Beneath 100-day MA
Key Support Levels: $2330, $2250, $2200.
Key Resistance Levels: $2470, $2600, $2720.
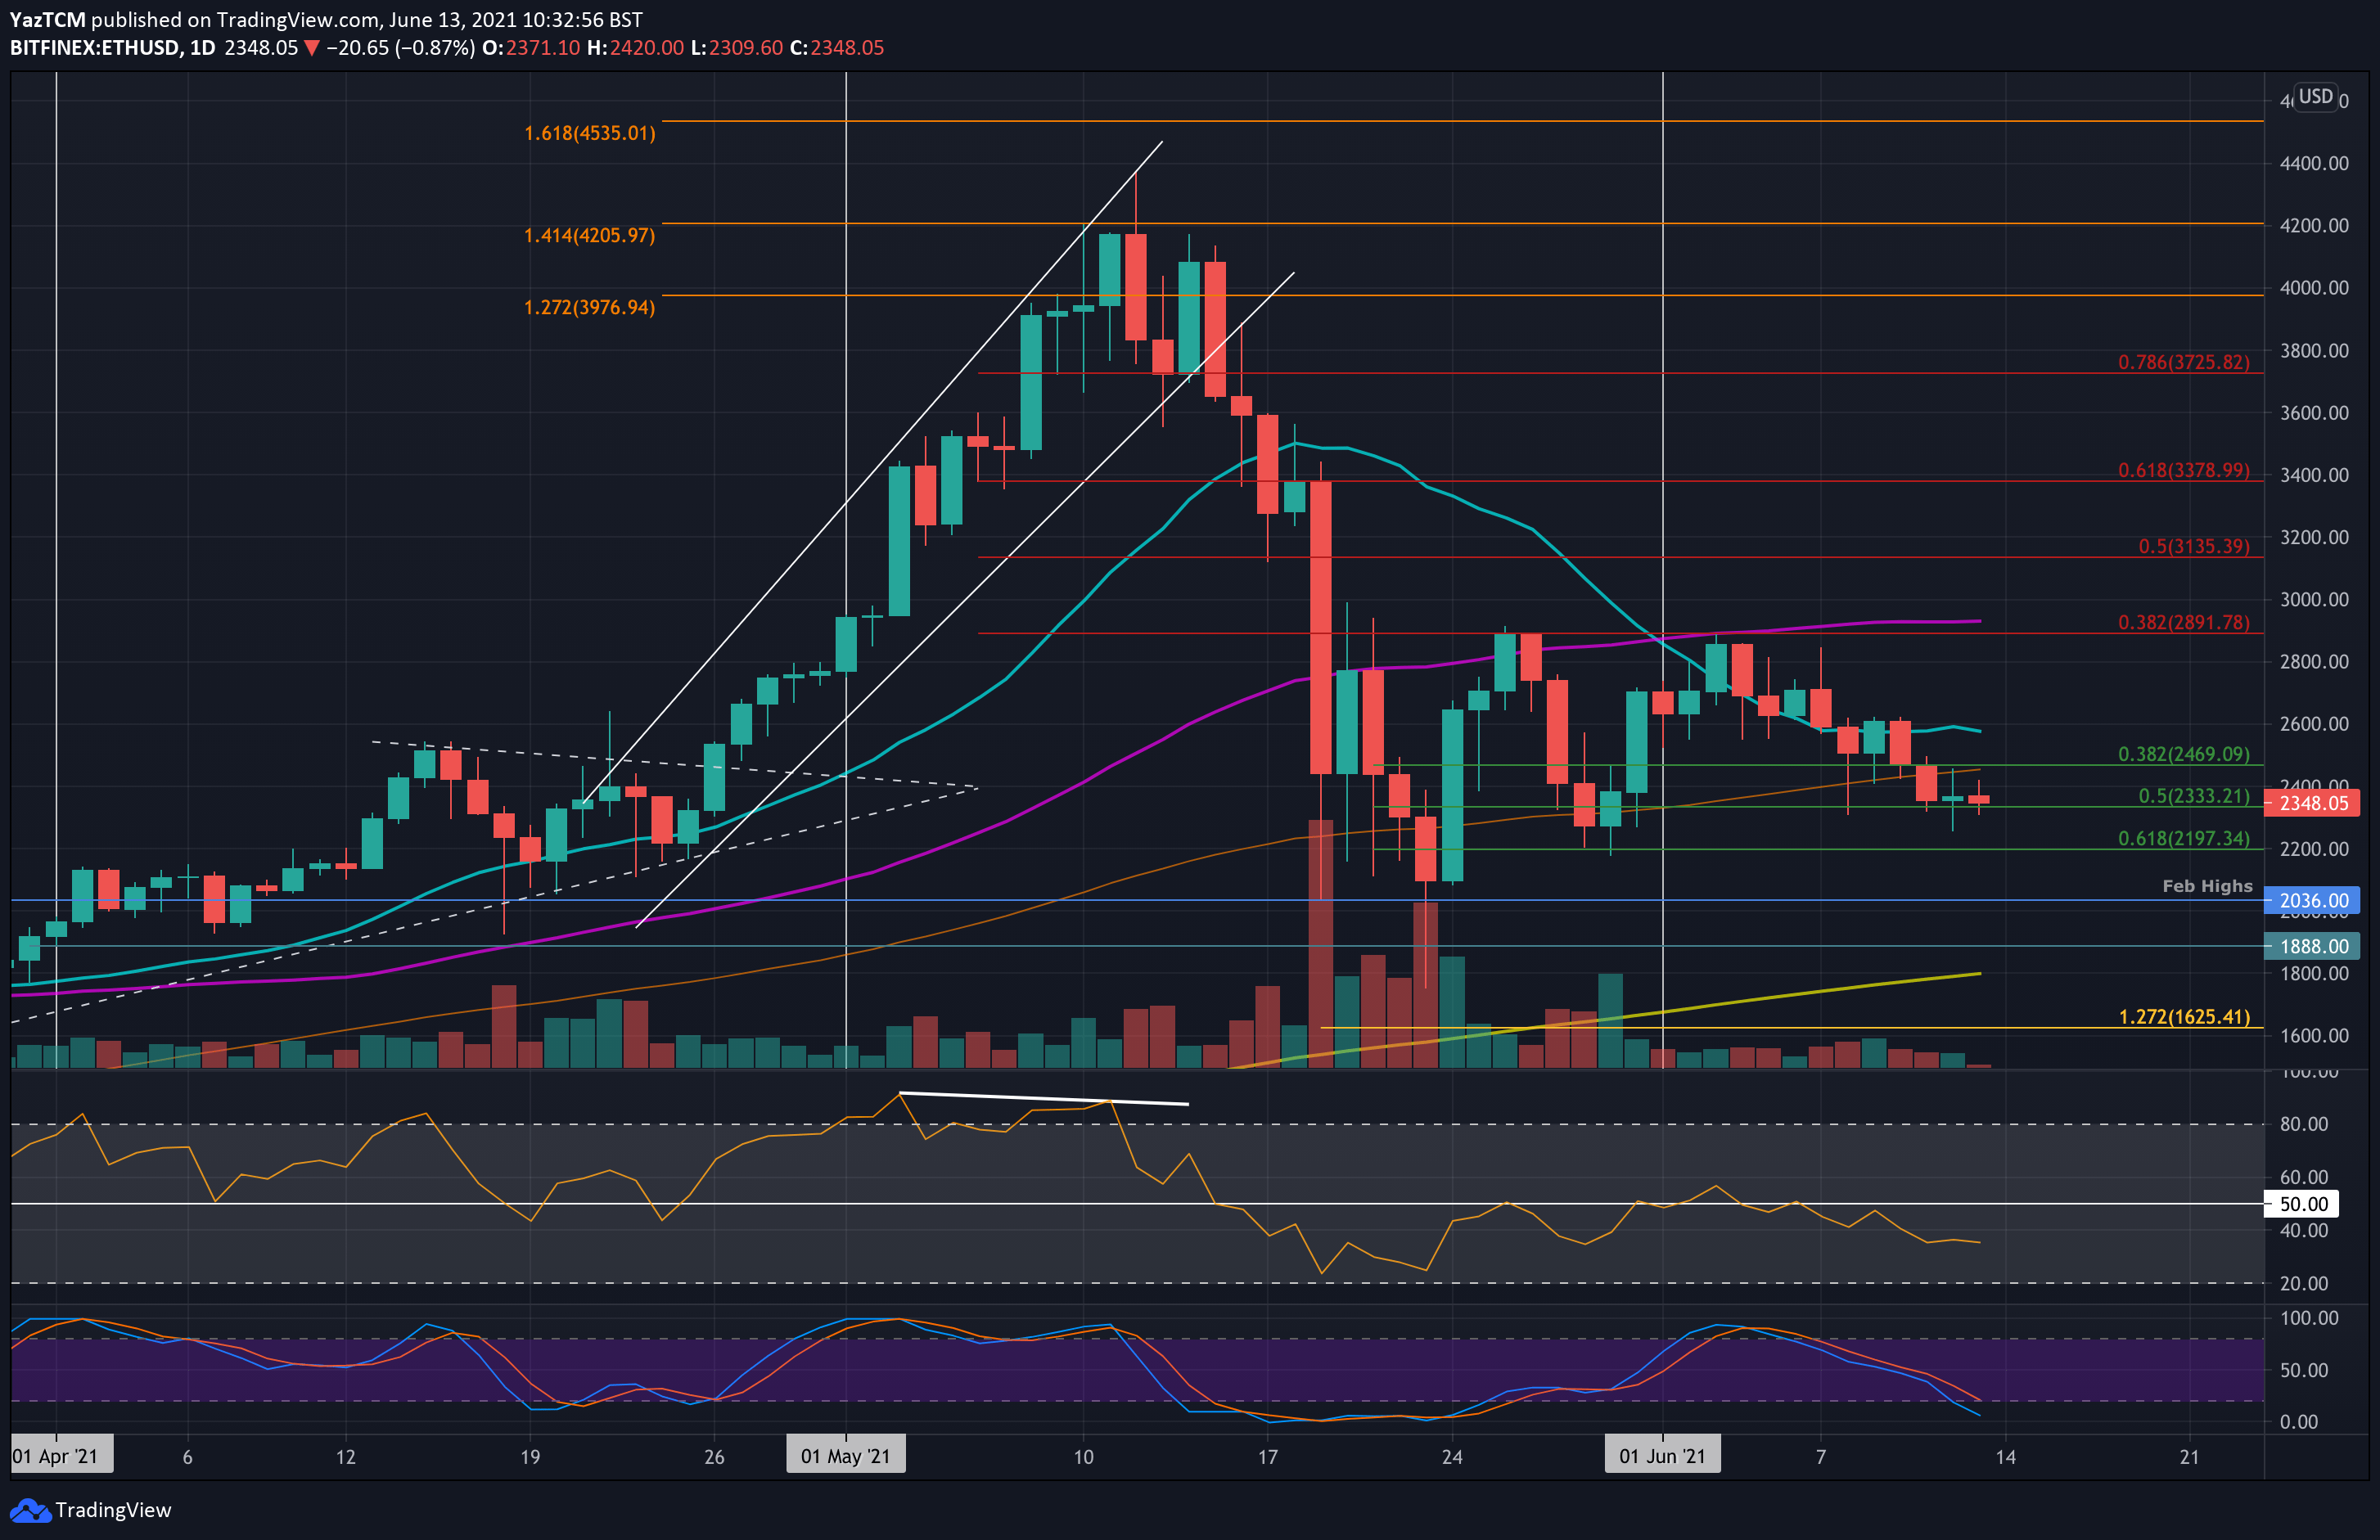
ETH failed to break the 50-day MA around $2890 at the start of June and, unlike bitcoin, ETH has been consistently dropping since. On Friday, ETH slipped beneath support at $2470 (.382 Fib) and slumped below the 100-day MA to find support around $2330 (.5 Fib).
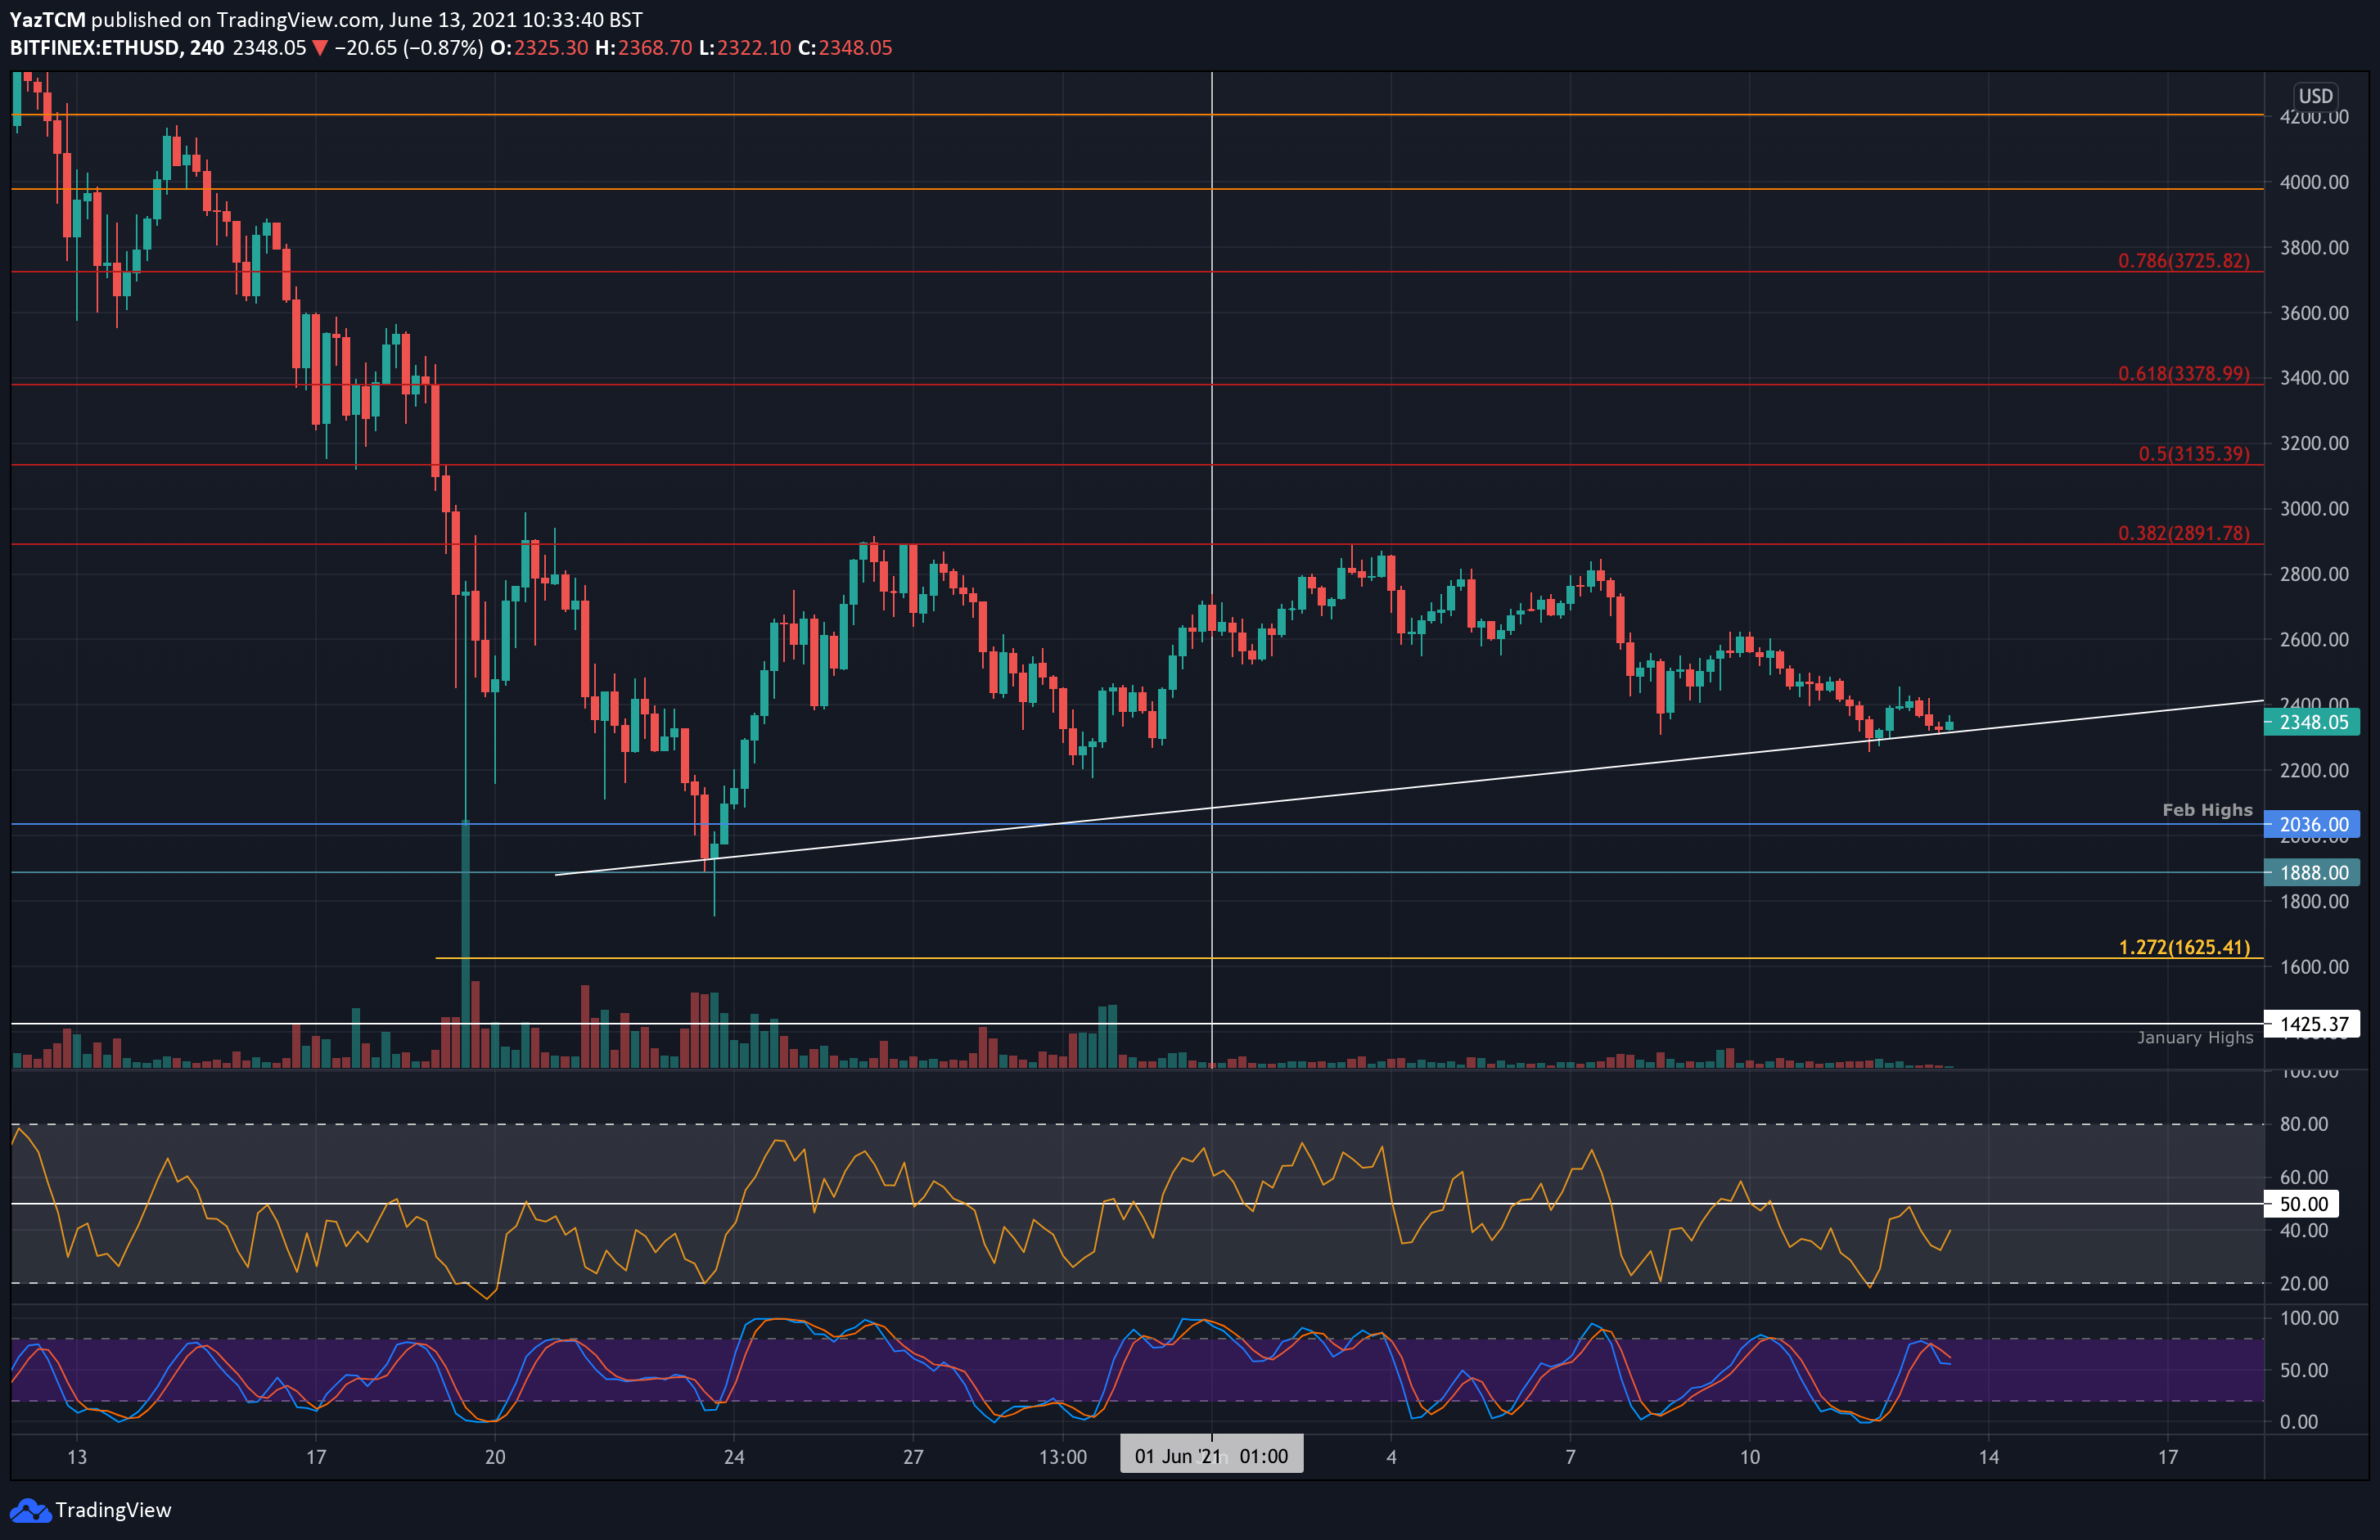
On the short-term charts, an ascending trend line provides support for the ETH/USD market. Combined with the .5 Fib at $2330, this trend line will be critical to defending over the coming days. Failing to do so, ETH is likely to head toward $2200 again, and even further down towards the $2k mark.
ETH-USD Short Term Price Prediction
Looking ahead, if the sellers break the support at $2330 (.5 Fib & ascending trend line), the first support lies at $2200 – $2250 area (.618 Fib), Slightly below lies $2K, which was the Feb 2021 highs.
On the other side, the first resistance lies at $2470 (100-day MA). This is followed by $2600 (20-day MA), $2720, $2800, and $2890 (bearish .382 Fib & 50-day MA).
The daily RSI is at the lowest level seen in June, indicating that the bears are starting to gain momentum. On the other hand, looking at the 4-hour chart, the RSI rebounded from oversold conditions during this weekend and is attempting to head back toward neutral territory. If the short-term momentum can turn bullish, it should help ETH remain above the critical trend line support.
The bottom line is that ETH/USD reaching a decision point.
ETH/BTC – Bulls Battle With 50-day MA
Key Support Levels: 0.065 BTC, 0.0628 BTC, 0.06 BTC.
Key Resistance Levels: 0.07 BTC, 0.0737 BTC, 0.077 BTC.
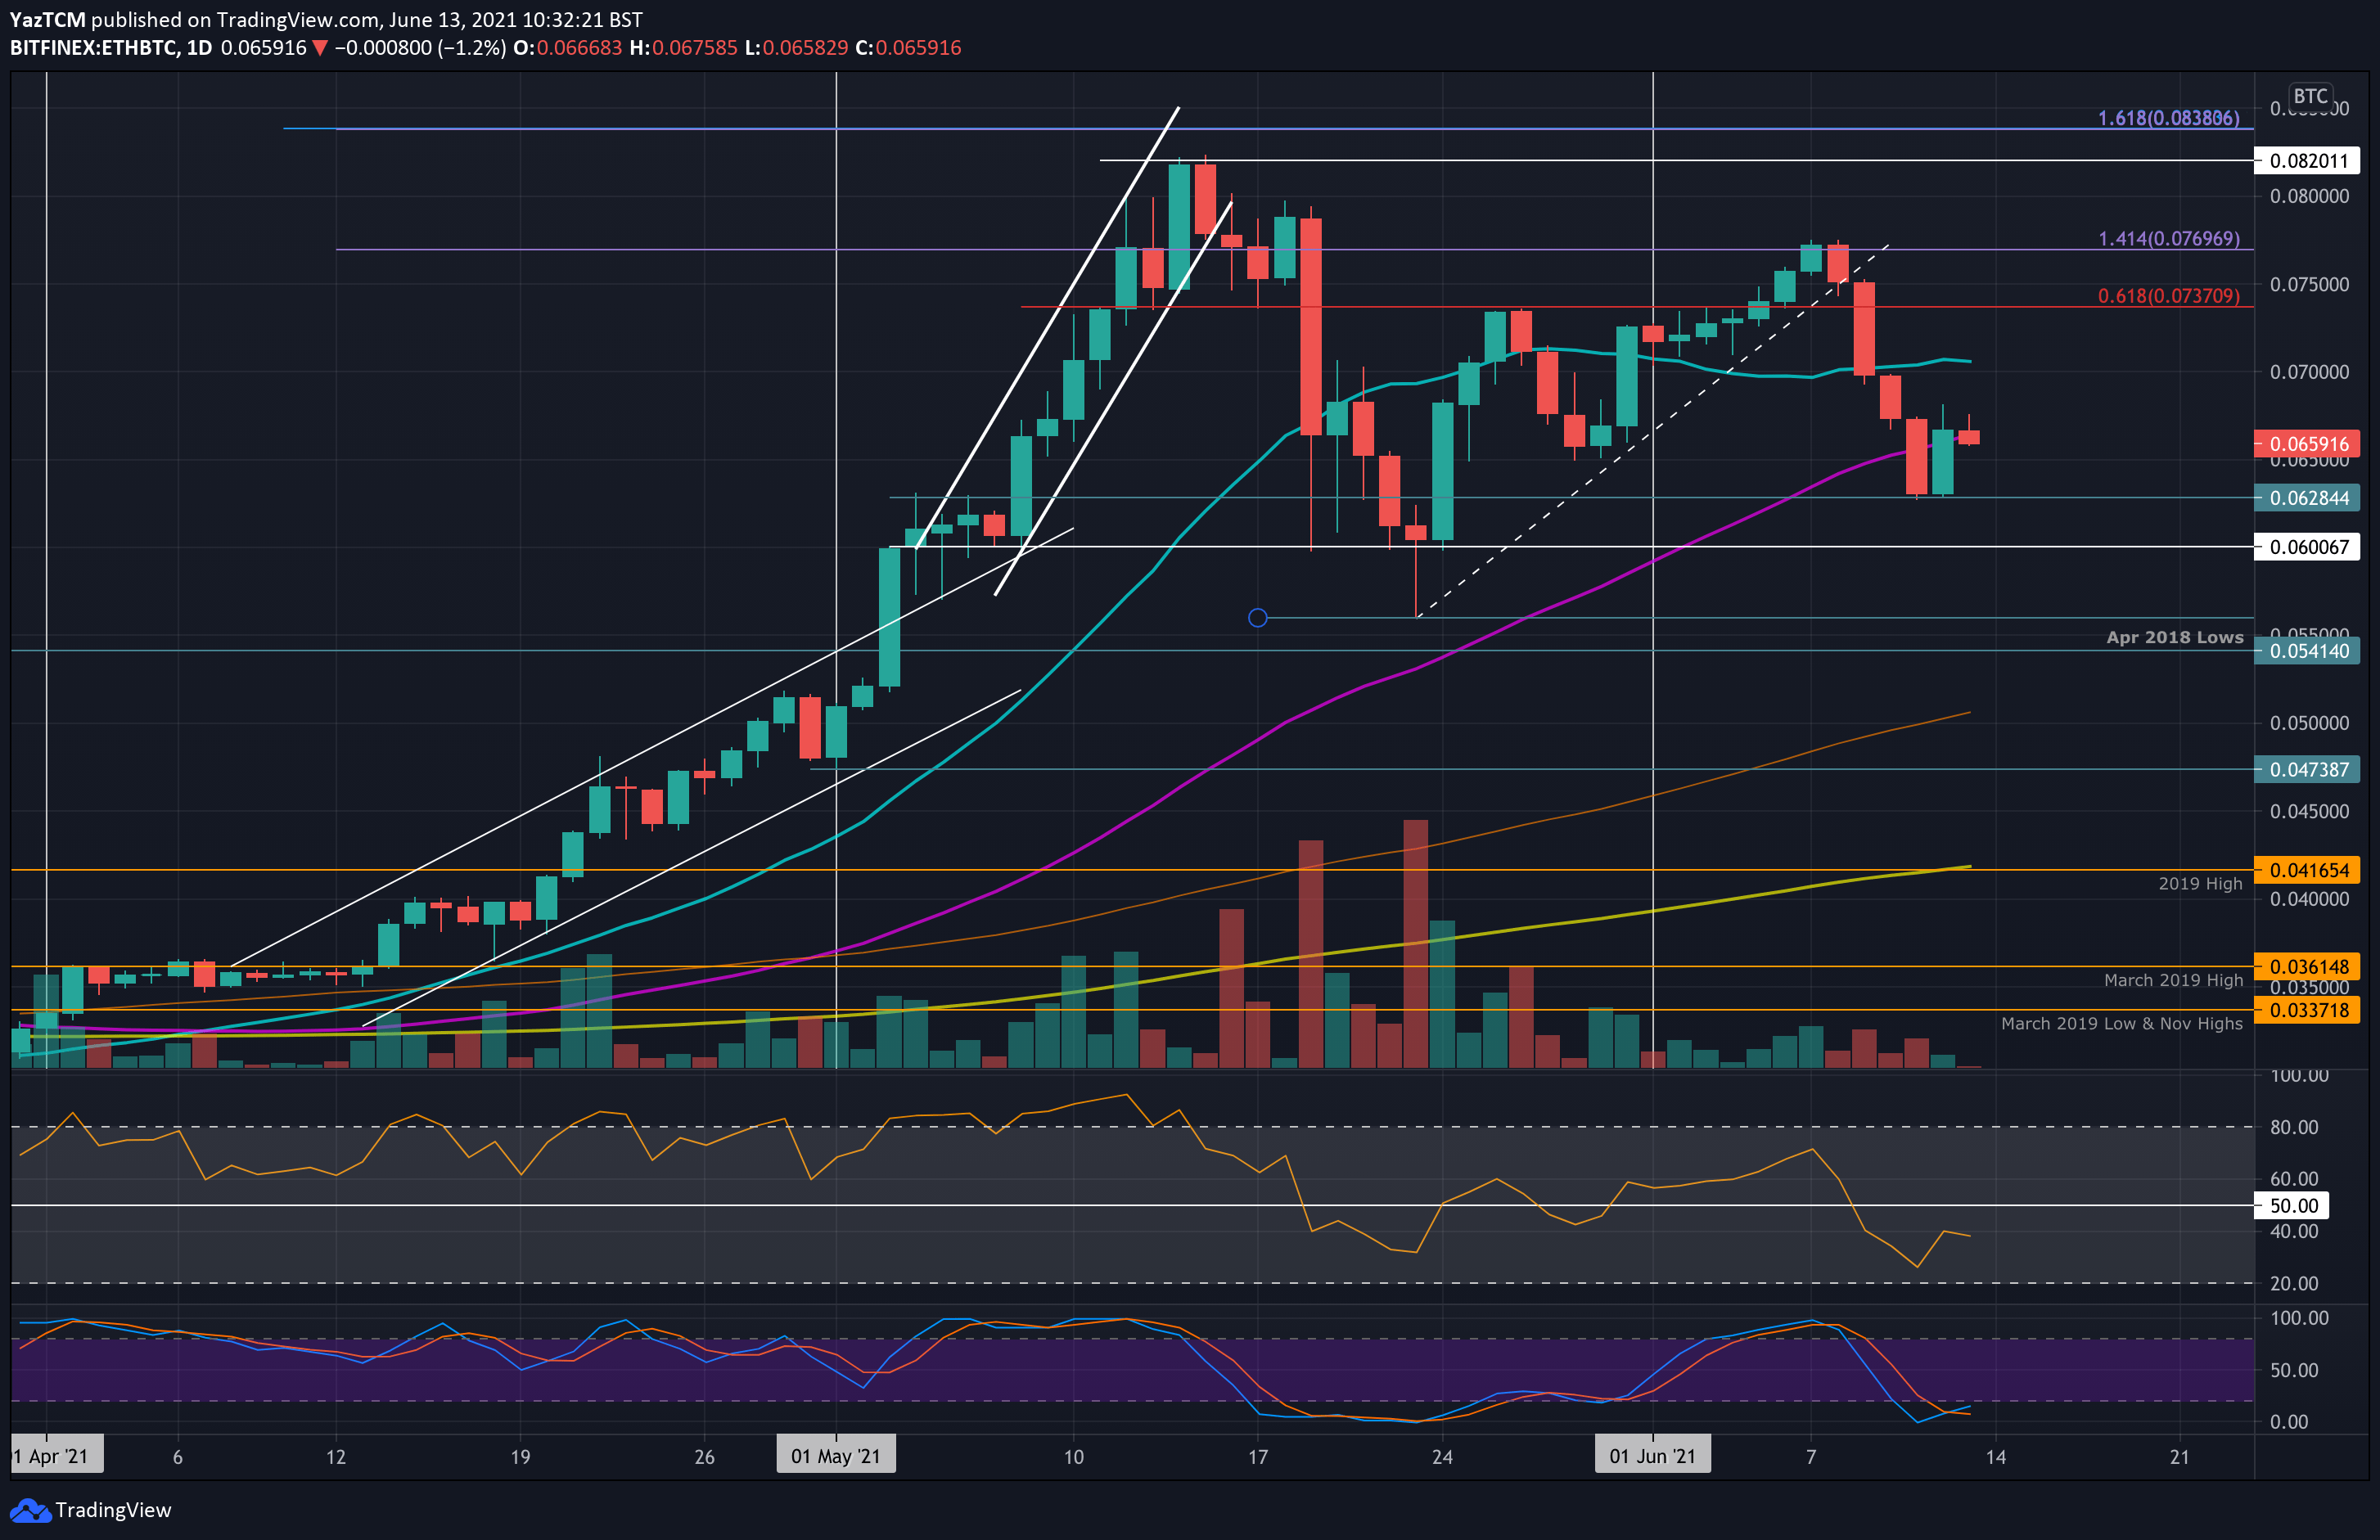
ETH continues to struggle against BTC. It was trading as high as 0.077 BTC (1.414 Fib Extension) at the start of the week but has since dropped beneath the 20-day MA at 0.07 BTC and continued to fall into support at 0.0628 BTC this weekend before a quick rebound toward the current trading levels of 0.066 BTC (50-day MA).
ETH-BTC Short Term Price Prediction
Looking ahead, if the bears push the market lower, the first support lies at the current level of 0.065 BTC. This is followed by 0.0628 BTC, 0.06 BTC, and 0.056 BTC (late-May low).
On the other side, the first resistance lies at 0.07 BTC (20-day MA). This is followed by 0.0737 BTC (bearish .618 Fib), 0.077 BTC (June highs), and 0.08 BTC.
The daily RSI sits beneath the midline and struggles to head back toward the neutral territory, indicating that the bears are still unwilling to relinquish control of the momentum right now.
Binance Futures 50 USDT FREE Voucher: Use this link to register & get 10% off fees and 50 USDT when trading 500 USDT (limited offer).
PrimeXBT Special Offer: Use this link to register & enter POTATO50 code to get 50% free bonus on any deposit up to 1 BTC.
Disclaimer: Information found on CryptoPotato is those of writers quoted. It does not represent the opinions of CryptoPotato on whether to buy, sell, or hold any investments. You are advised to conduct your own research before making any investment decisions. Use provided information at your own risk. See Disclaimer for more information.
Cryptocurrency charts by TradingView.
Author: Yaz Sheikh ::: Source link


 Out? Price Tanks 15% On Whale Exodus")