
ETH/USD – Ethereum Bulls Push To Fresh 2020 Highs
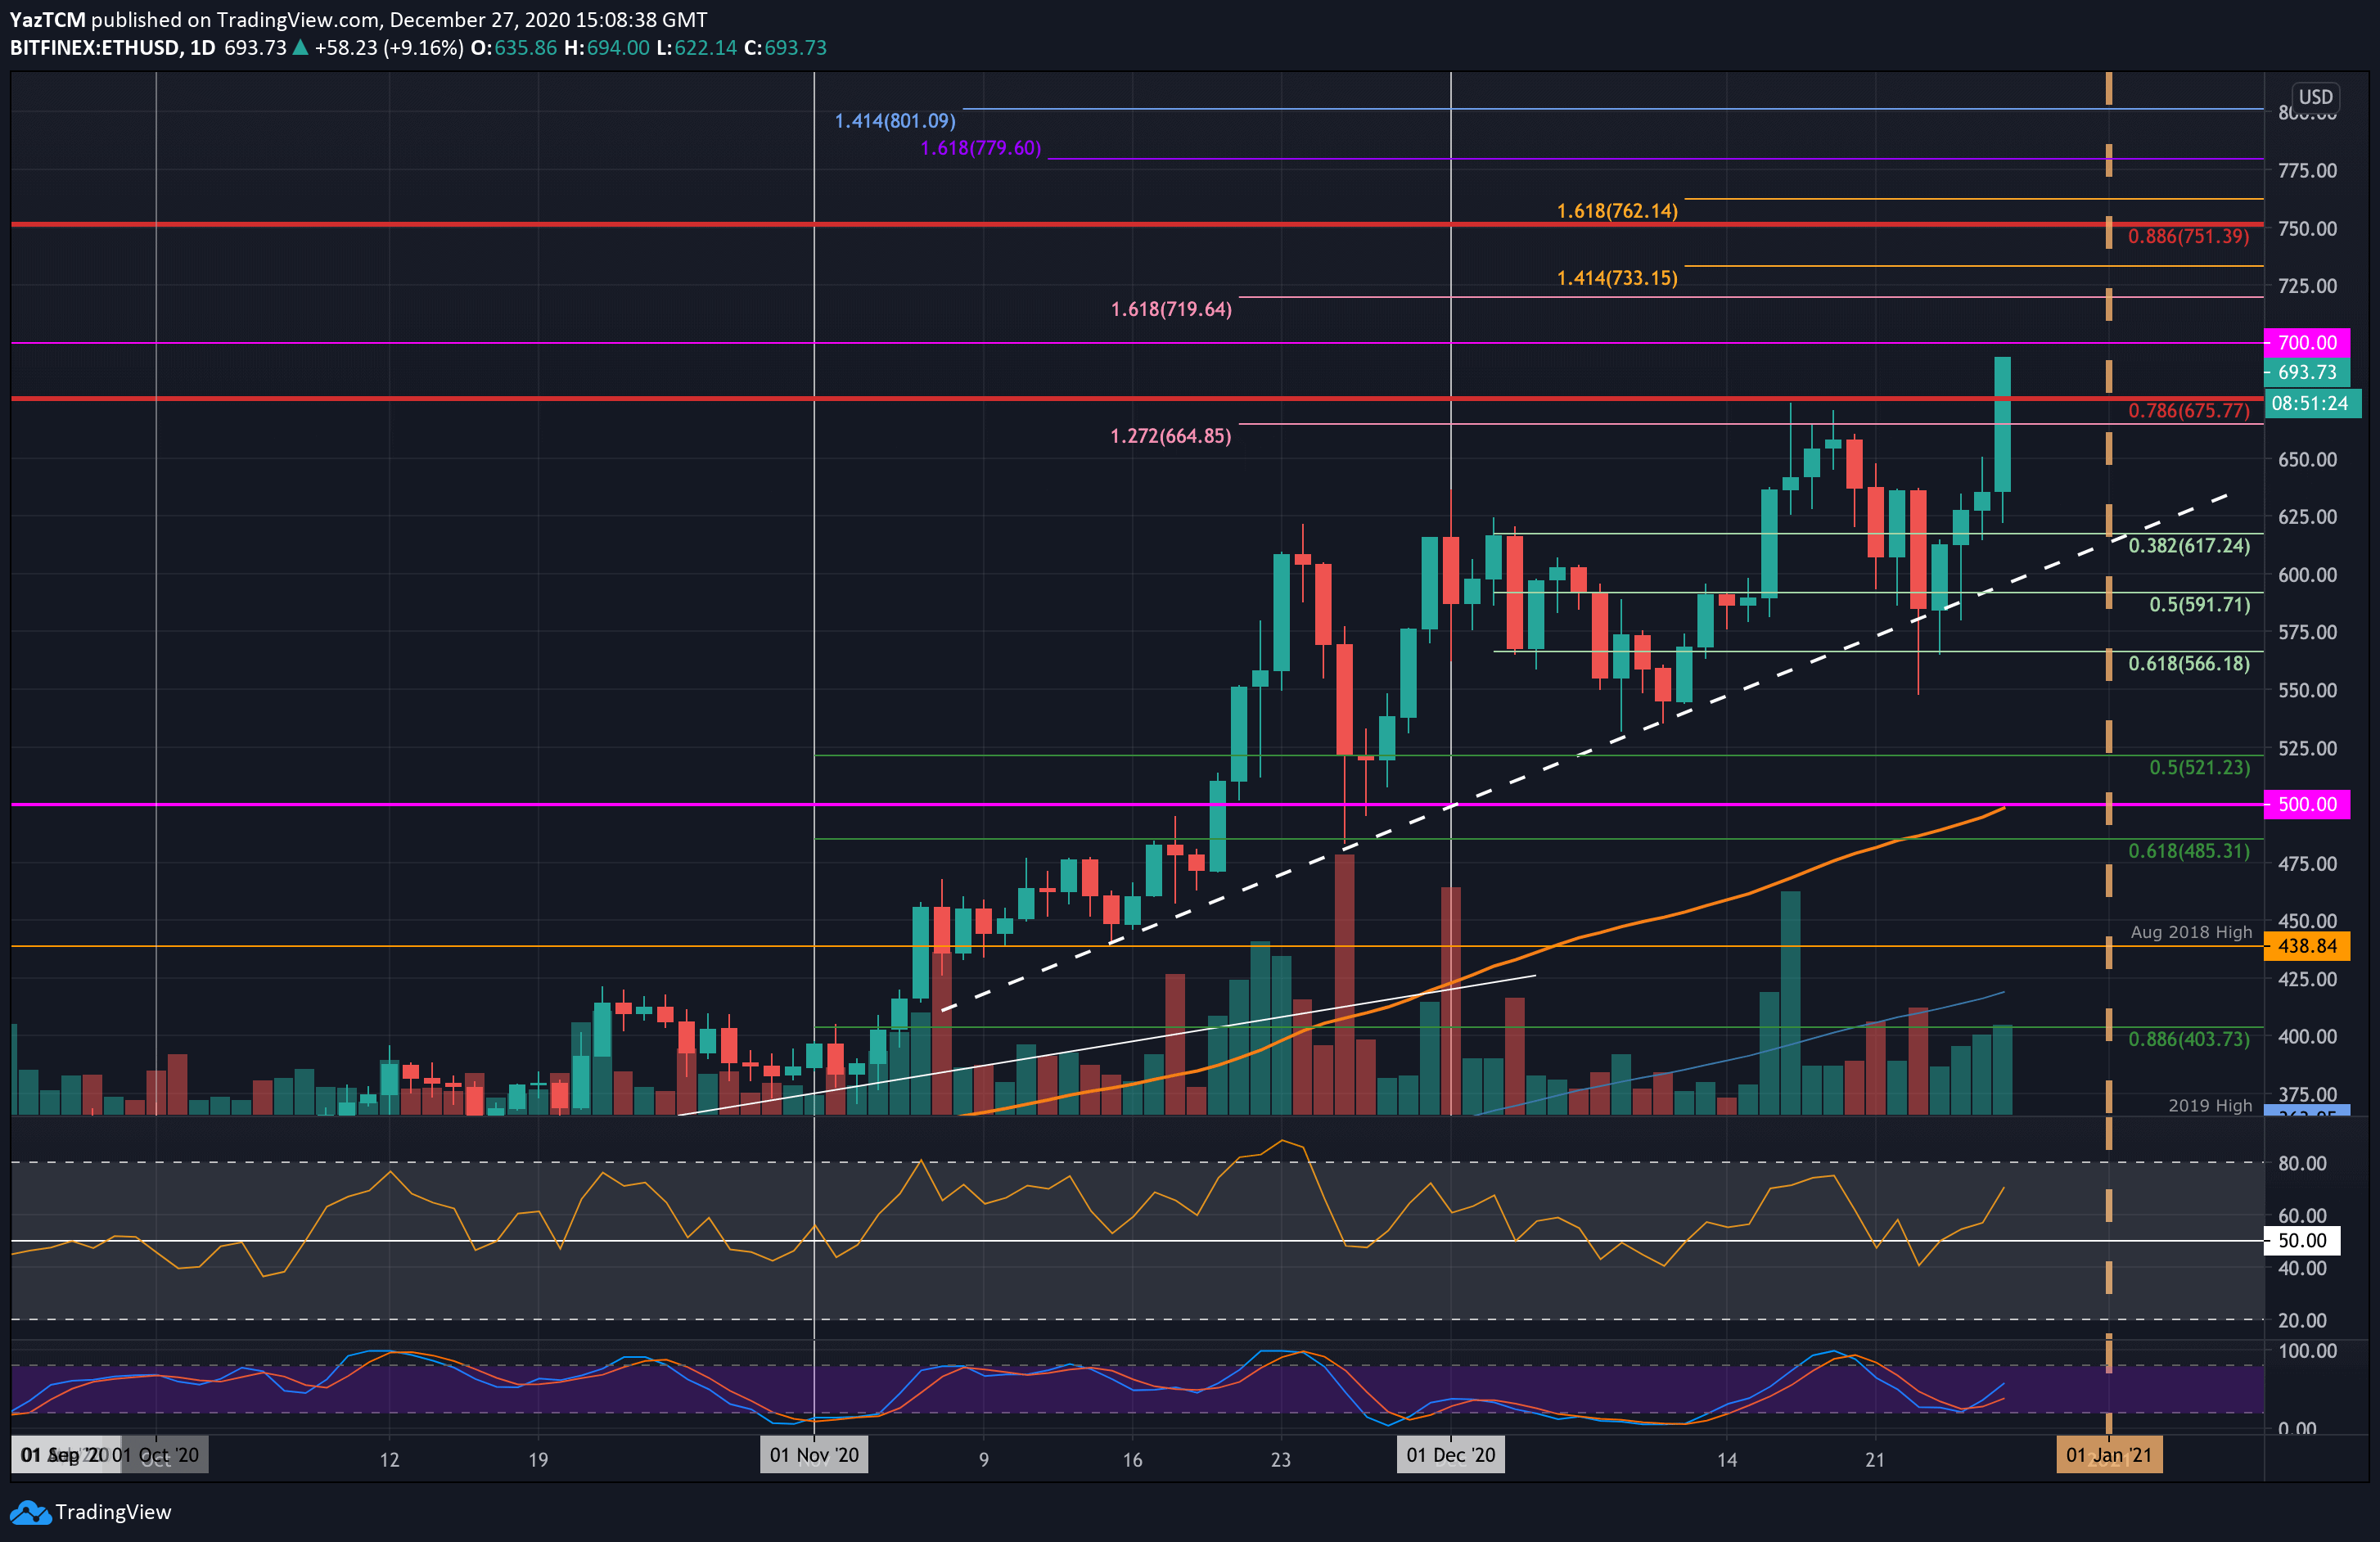
Key Support Levels: $675, $665, $617.
Key Resistance Levels: $700, $720, $733.
Yesterday, Ethereum was struggling to break beyond $630. The resistance was finally penetrated today as it continued further above the previous 2020 high at $675 (bearish .786 Fib Retracement) to reach as high as $695 today.
The break beyond $675 allowed ETH to create a fresh 2020 high today. With the current momentum in the market, it is likely that ETH will break further beyond $700 today and could potentially hit $720.
ETH-USD Short Term Price Prediction
Looking ahead, if the buyers break past $700, the first level of resistance lies at $720. This is followed by $733, $751 (bearish .886 Fib Retracement), $762, and $780.
On the other side, the first level of support lies at $675. Beneath this, support is located at $665, $617 (.382 Fib), $700, and $591 (.5 Fib).
The Stochastic RSI produced a bullish crossover that allowed it to surge higher today. Additionally, the RSI is well above the mid-line as the buying momentum increases.
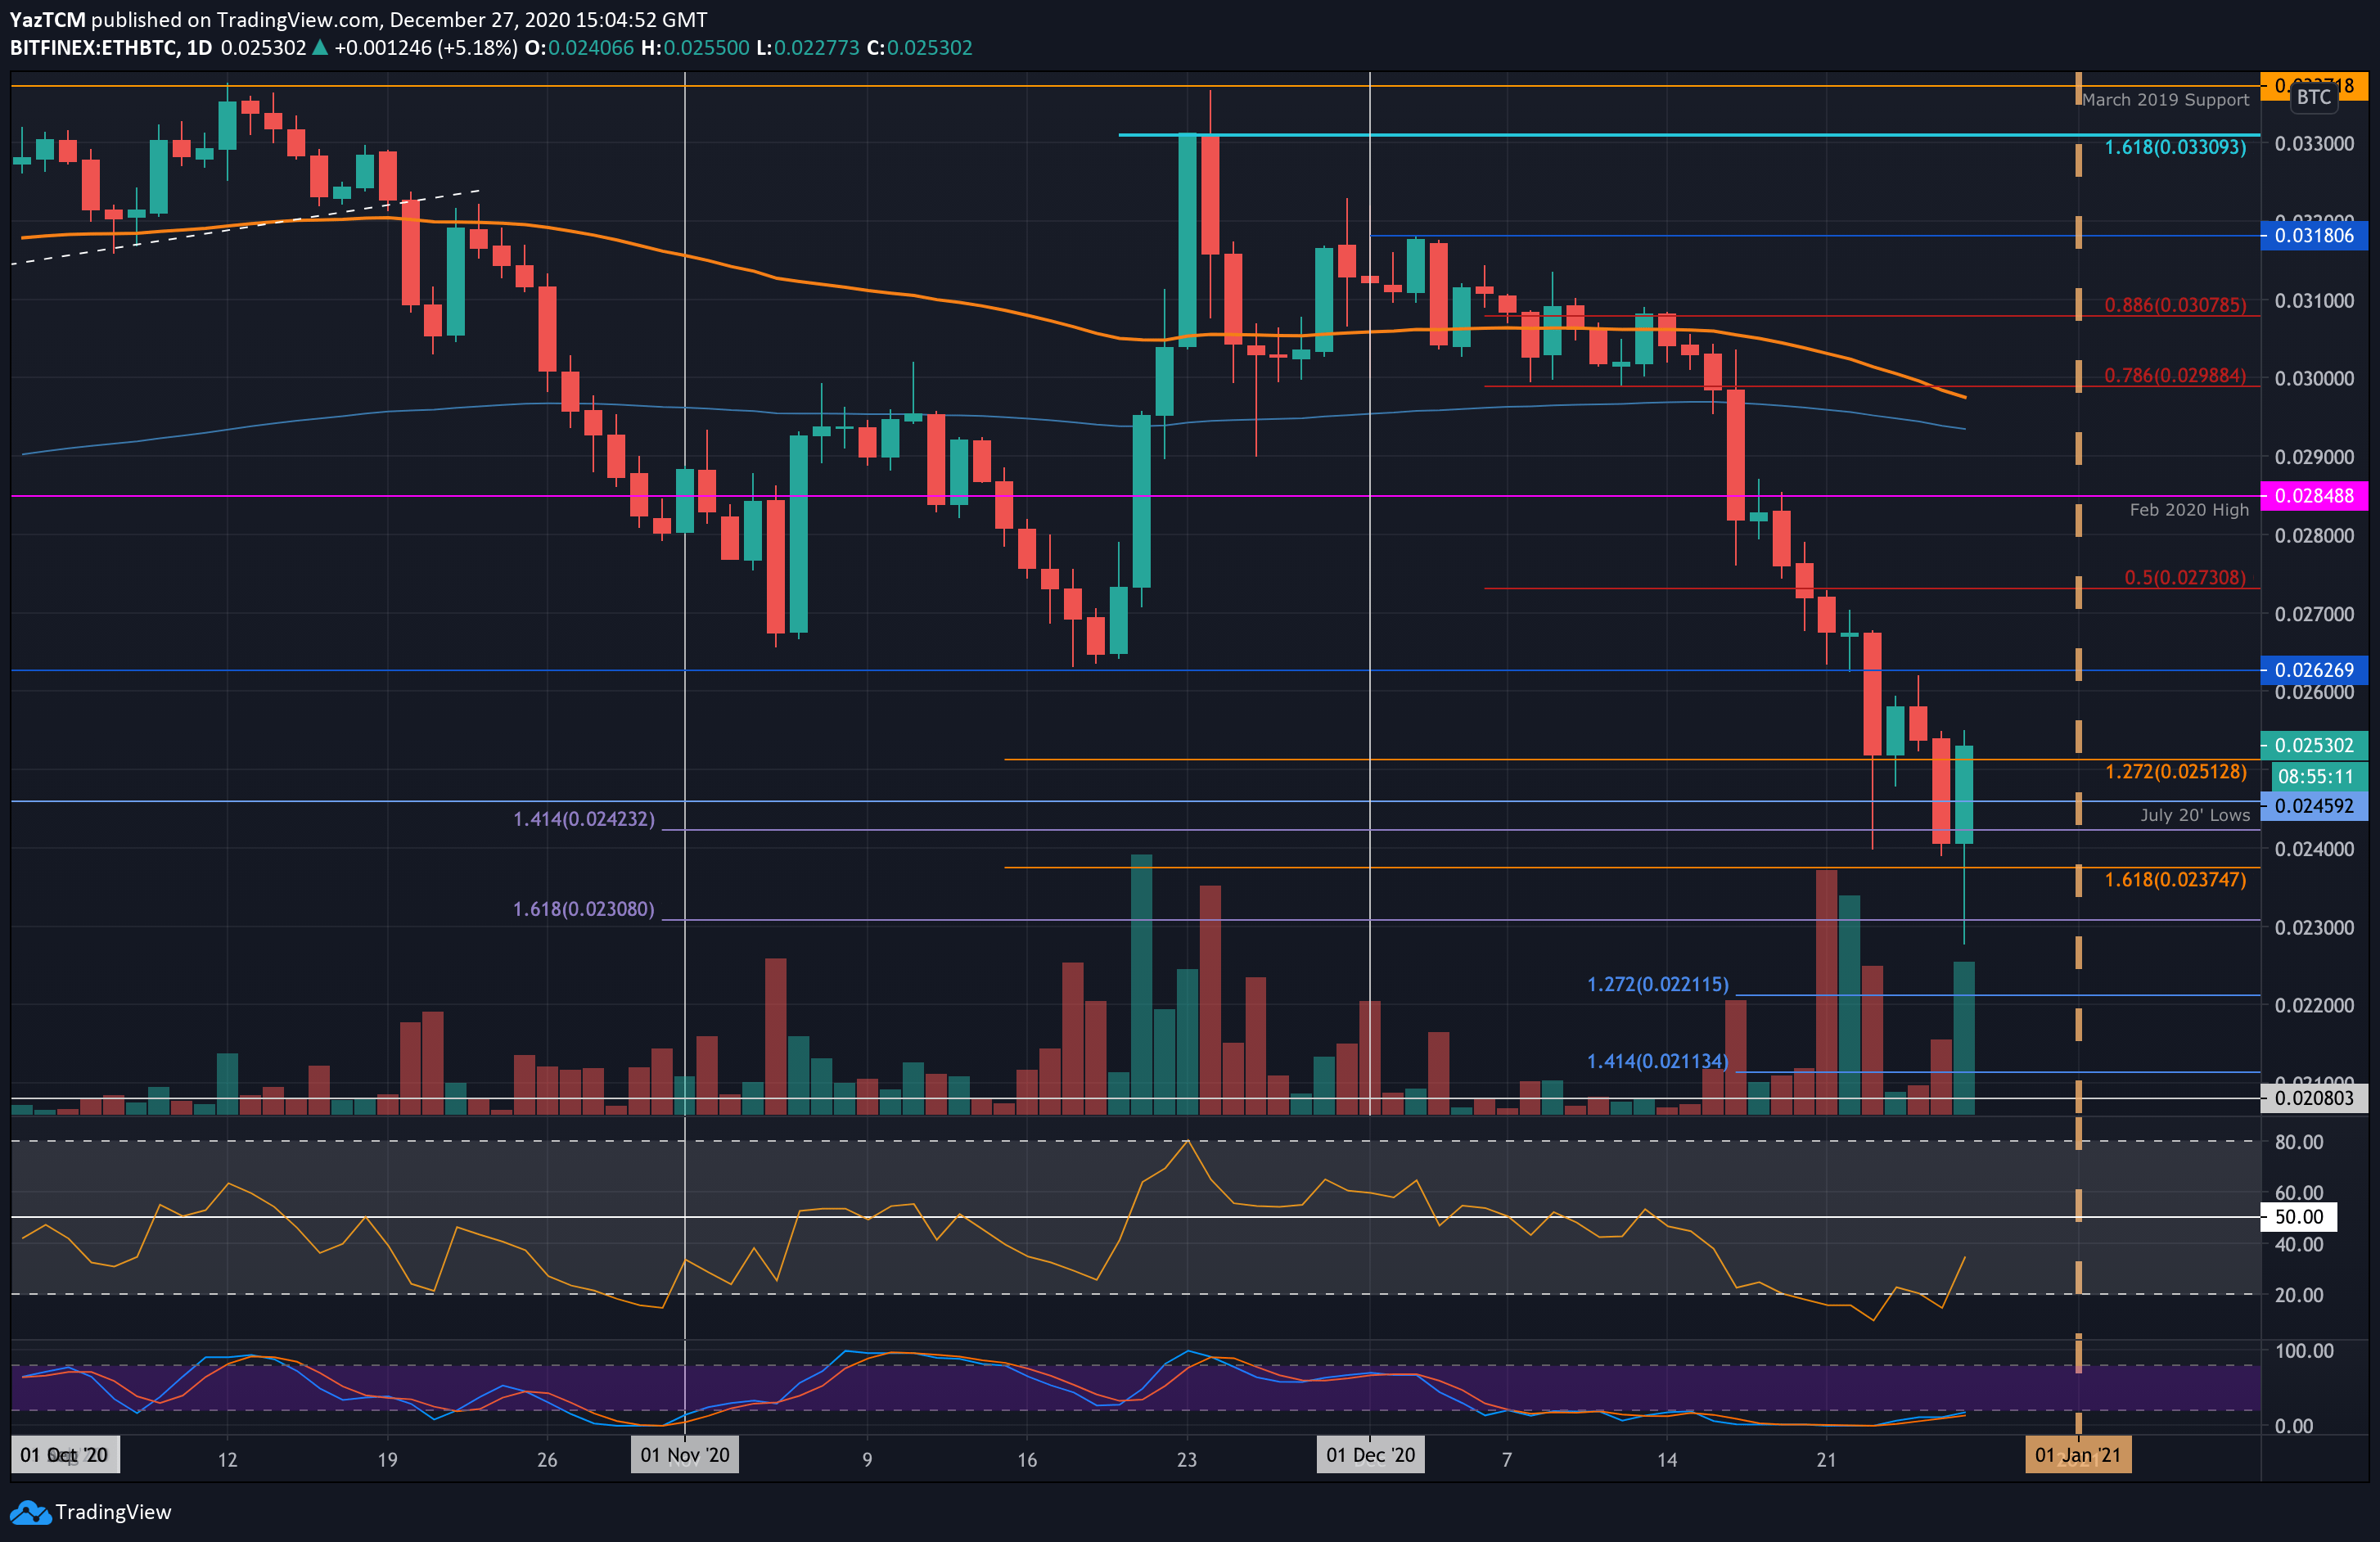
ETH/BTC – ETH Rebounds After Seeing Fresh 7-Month Low
Key Support Levels: 0.025 BTC, 0.0245 BTC, 0.0242 BTC.
Key Resistance Levels: 0.026 BTC, 0.0262 BTC, 0.027 BTC.
Against Bitcoin, Ethereum fell beneath the 0.025 BTC support yesterday to create a fresh 7-month low at 0.024 BTC. Today, ETH spiked further beneath 0.024 BTC to reach as low as 0.0227 BTC.
Luckily, the buyers regrouped quickly to allow ETH to rebound from here and climb back above 0.025 BTC. It is now trading at 0.0253 BTC.
ETH-BTC Short Term Price Prediction
Looking ahead, if the buyers continue to drive higher, the first level of resistance lies at 0.026 BTC. This is followed by 0.0262 BTC, 0.027 BTC, and 0.0273 BTC (bearish .5 Fib Retracement).
On the other side, the first level of support is now located at 0.025 BTC. This is followed by 0.0245 BTC (July 2020 Low), 0.0242 BTC, 0.024 BTC. Added support is found at 0.0237 BTC and 0.023 BTC.
The RSI has started to rebound from extremely oversold conditions, suggesting that the bearish momentum is started to ease up a little. Additionally, the Stochastic RSI is primed for a bullish crossover that should aid the recovery.
PrimeXBT Special Offer: Use this link to register & enter CRYPTOPOTATO35 code to get 35% free bonus on any deposit up to 1 BTC.
Disclaimer: Information found on CryptoPotato is those of writers quoted. It does not represent the opinions of CryptoPotato on whether to buy, sell, or hold any investments. You are advised to conduct your own research before making any investment decisions. Use provided information at your own risk. See Disclaimer for more information.
Cryptocurrency charts by TradingView.
Author: Yaz Sheikh ::: Source link


